

Plotted: 2025 Conference Data Update
My take with charts and analysis


Introduction
With April General Conference this past weekend, we have facts and statistics released for this year. This link provides a good summary of all of the changes that you can read and also the author plots a few charts here1. I’ll just point out a few positive and negative things that stuck out to me.
If you don’t want to get bogged down in the analysis, the TLDR? Good news is more missionaries and converts. Bad news is more exits and low birth rates.
Good News: Missionary Work
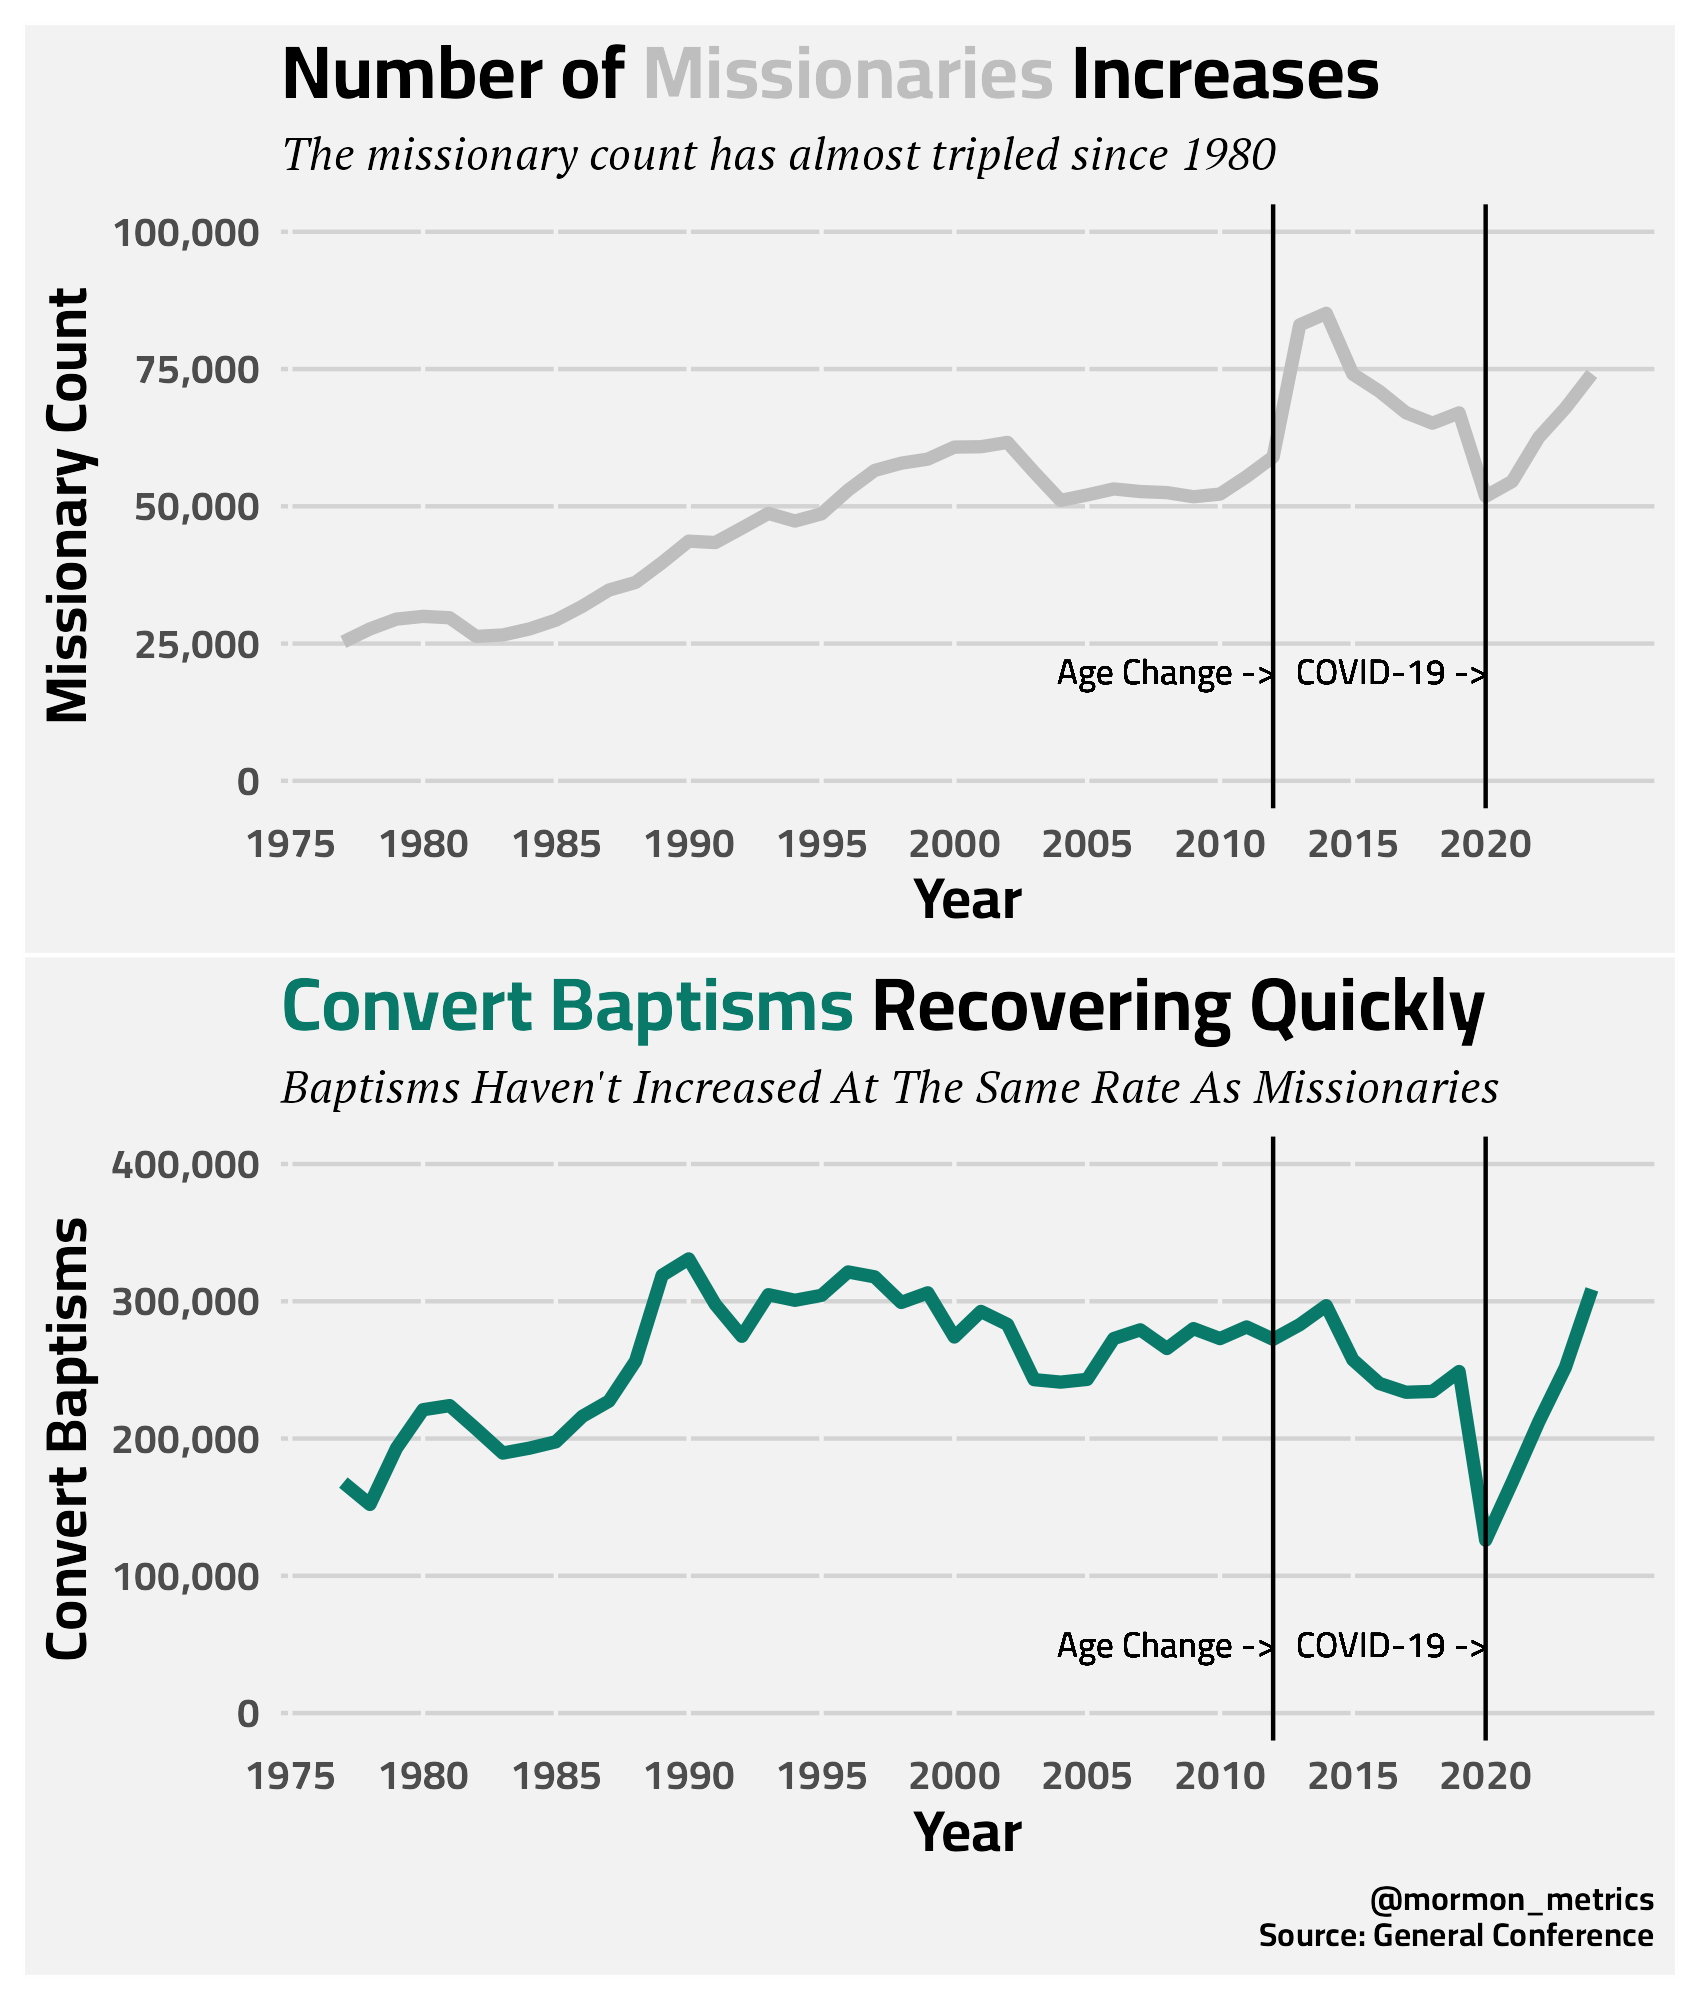
I have shared these charts before, but now we have the 2024 data added to them! Here are the two takeaway from this chart…
We continue to see an increase in missionaries to one of the highest number of missionaries the church has ever seen - just under 75k missionaries. This is was a ~9% increase from the previous year with 68k missionaries.
Also, convert baptisms saw a 22% annual increase from 250k to 308k. This is a significant increase and represents one of the largest number of convert baptisms in modern church history.
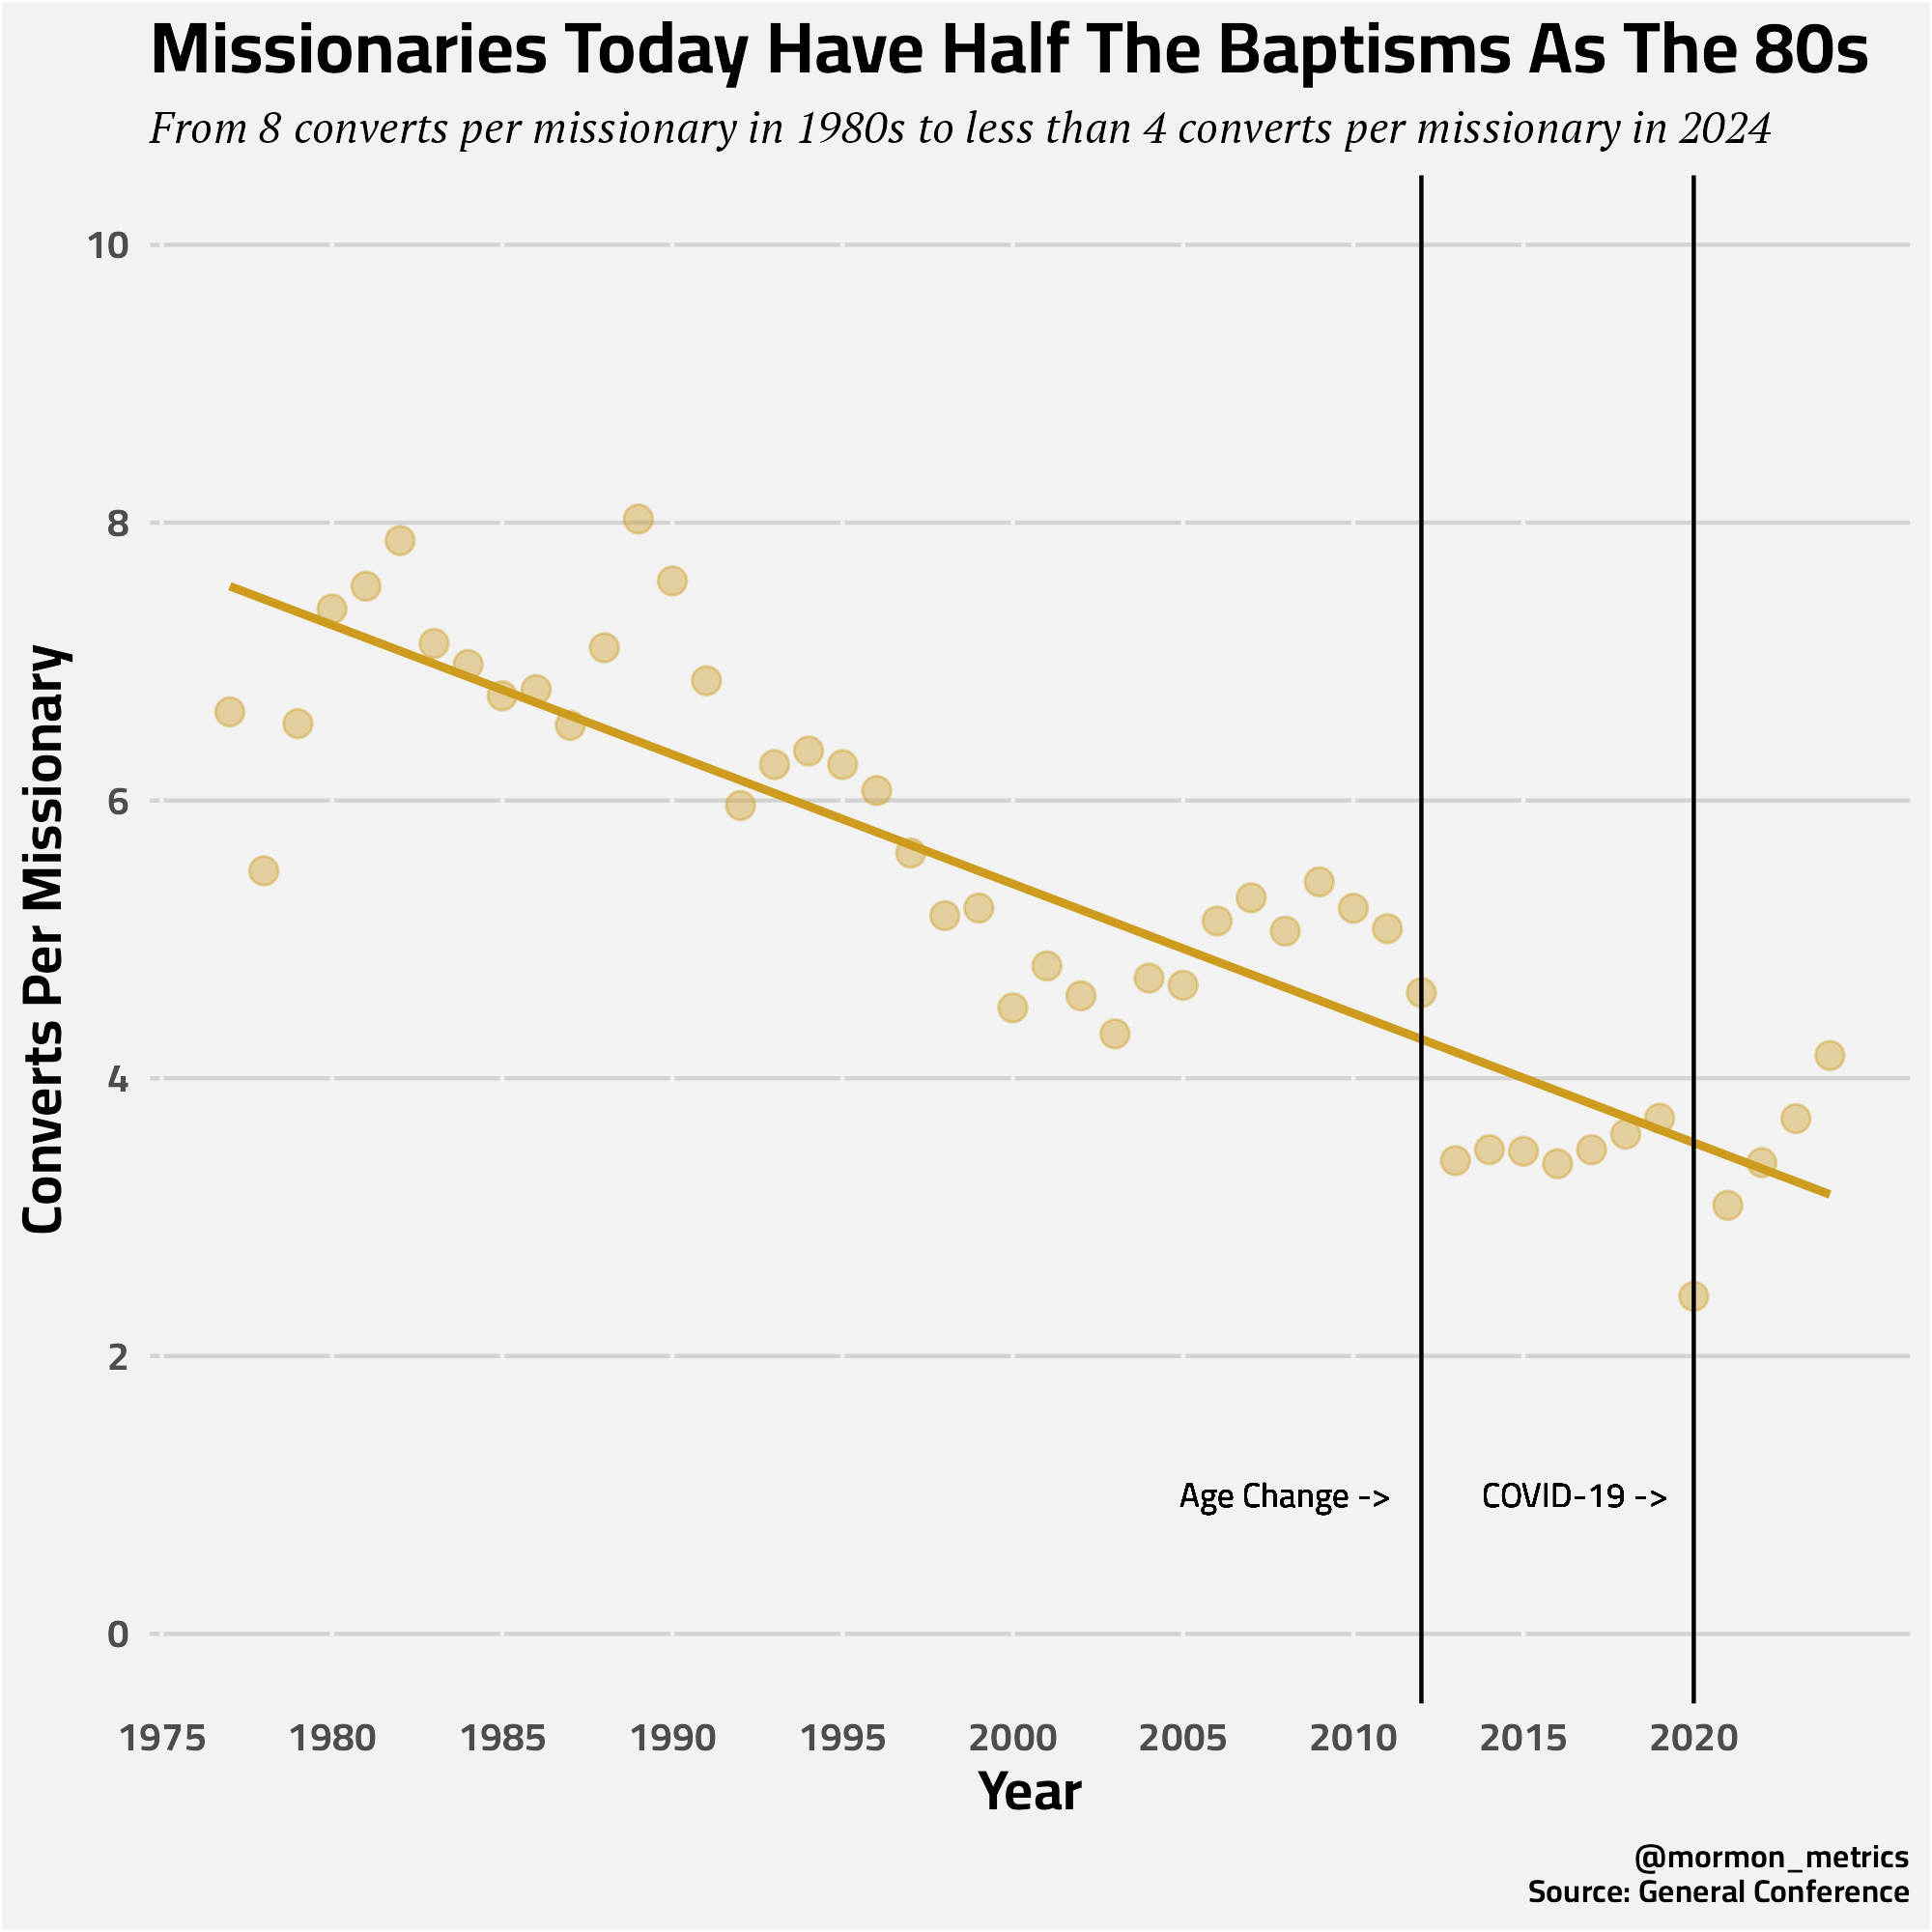
Another thing I’ll mention is that even though the convert baptism rate per missionary is still down from what it once was, this metric has recovered since precovid levels. This means that the average missionary saw more baptisms in 2024 compare to the previous 3 years. This is more good news!
Not As Good News: Growth Through Children of Record + Exits
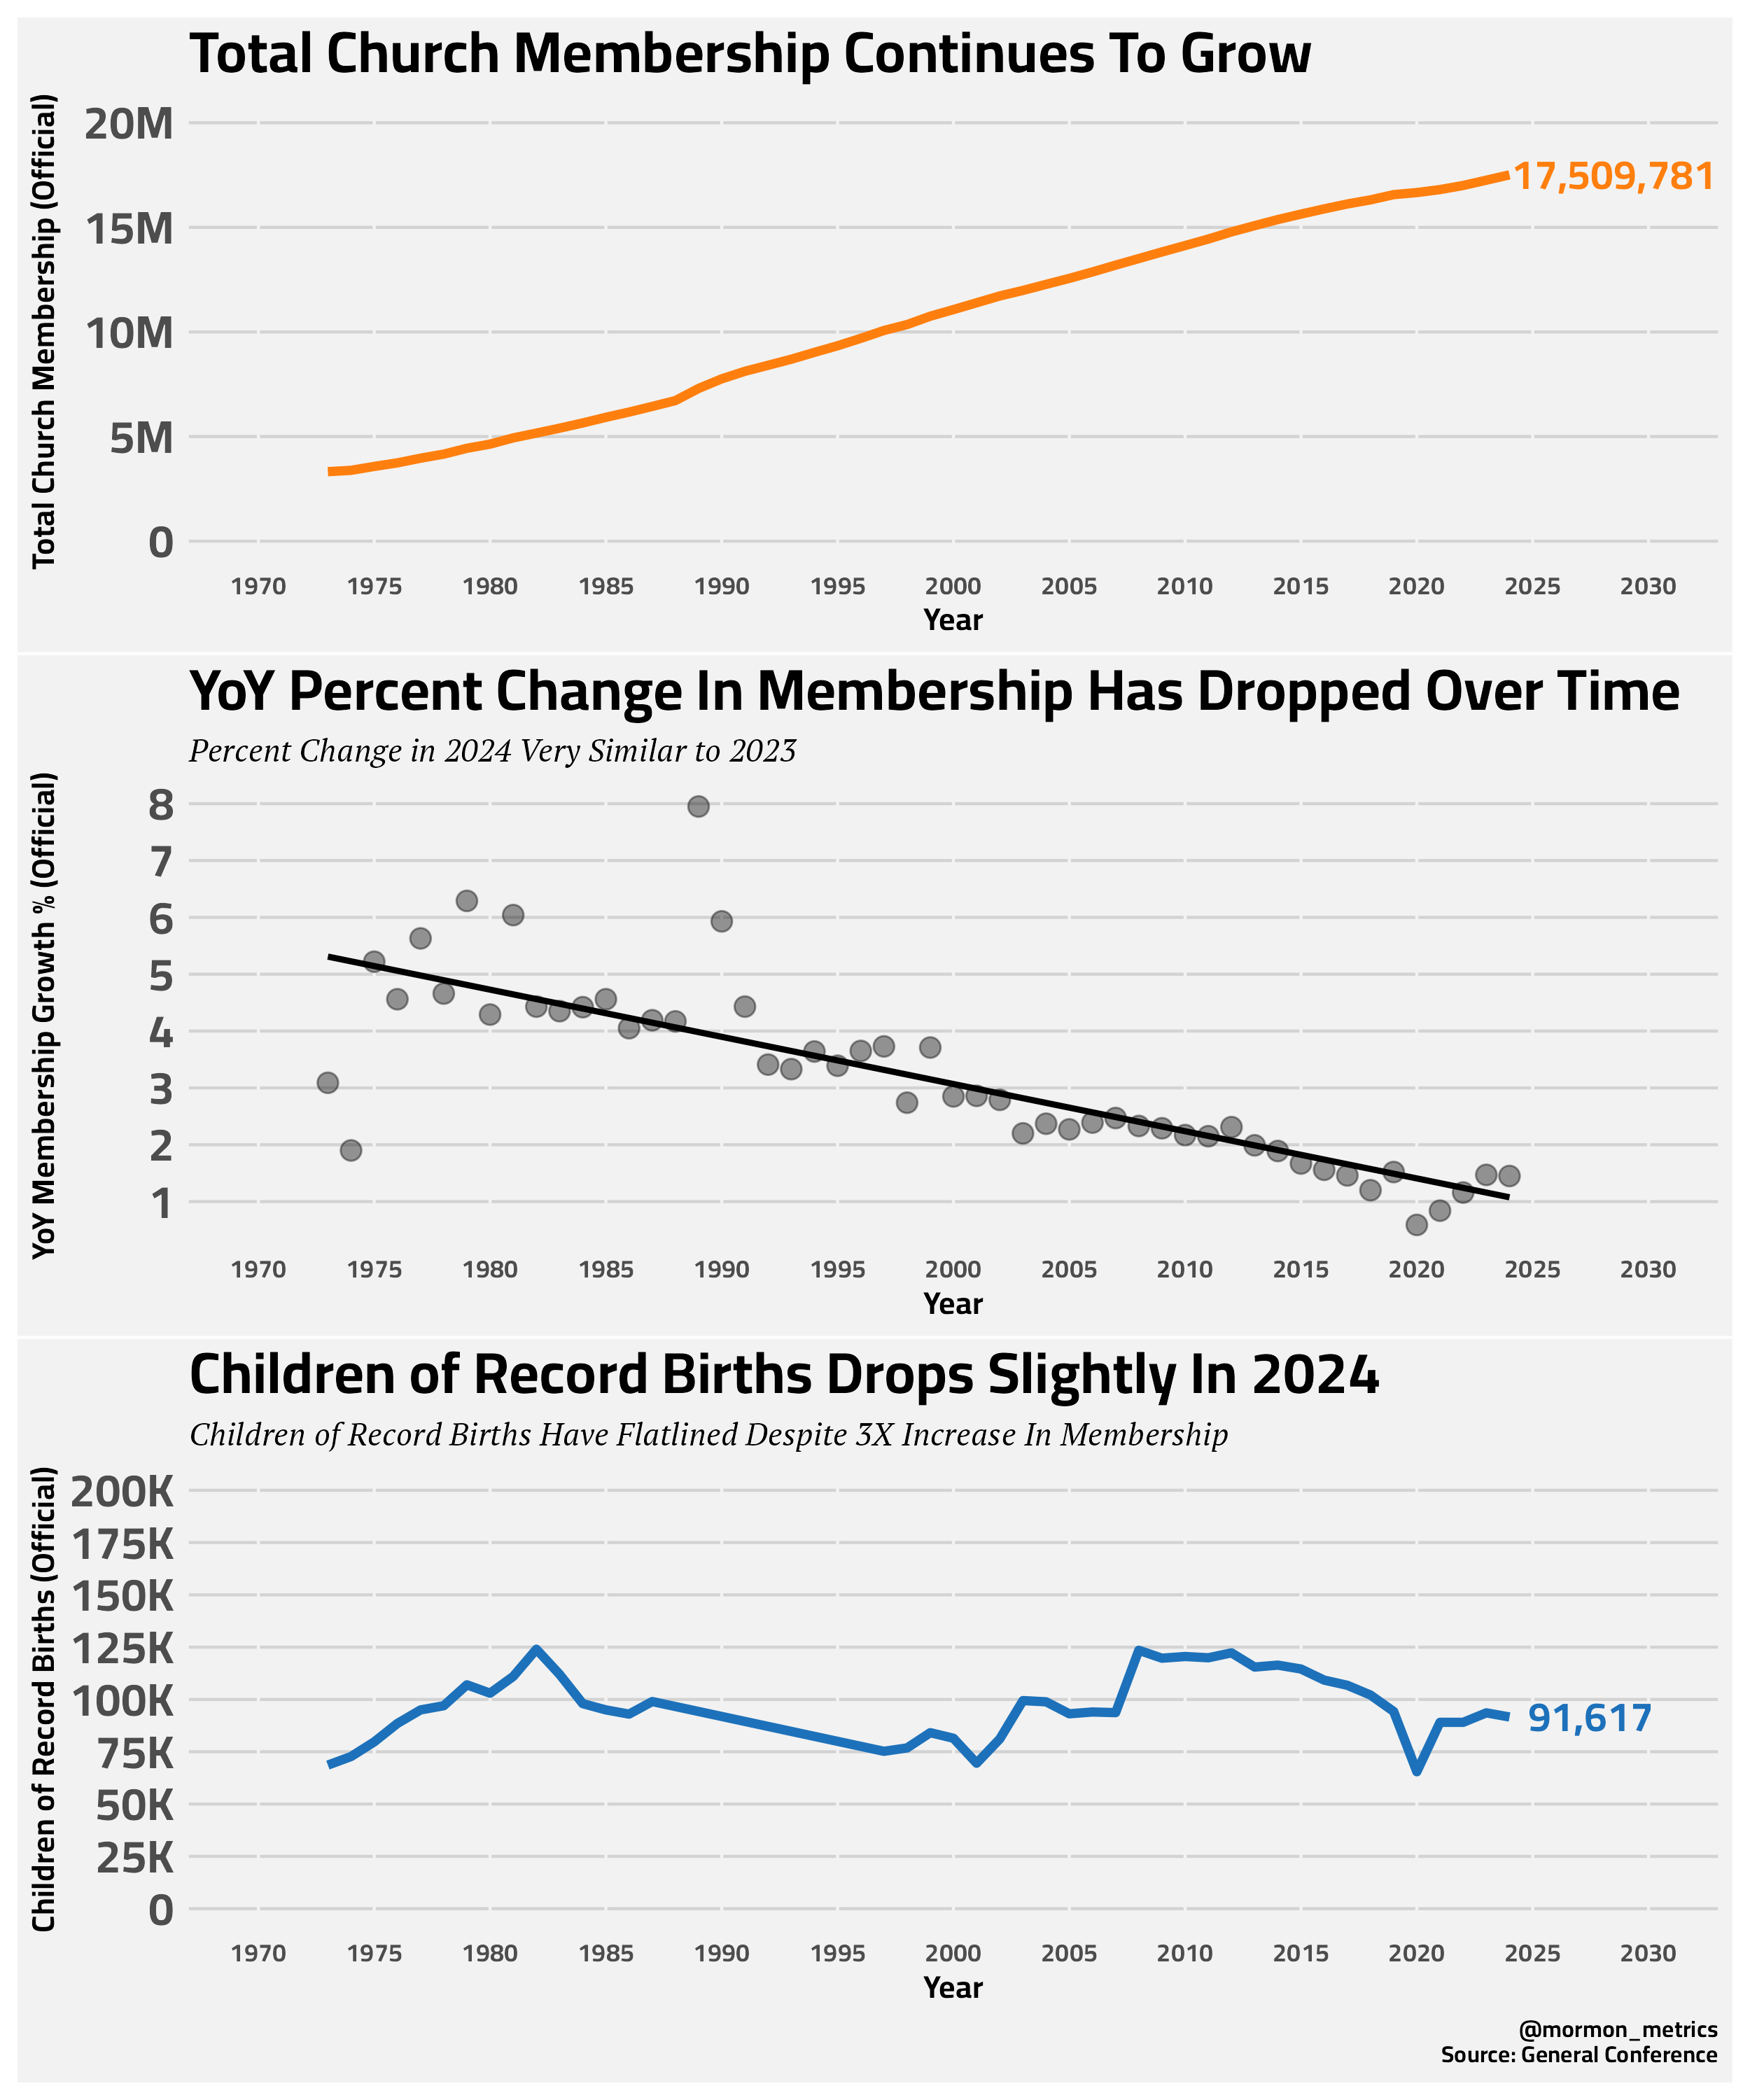
One interesting thing about this data is the trends in Total Church Membership versus Children of Record births.
We have seen a 4X-5X increase in total church membership since 1980, but the number of children of record births is the same or lower. How can this be?
Here is another way to look at this data as “births per 1000 members.“
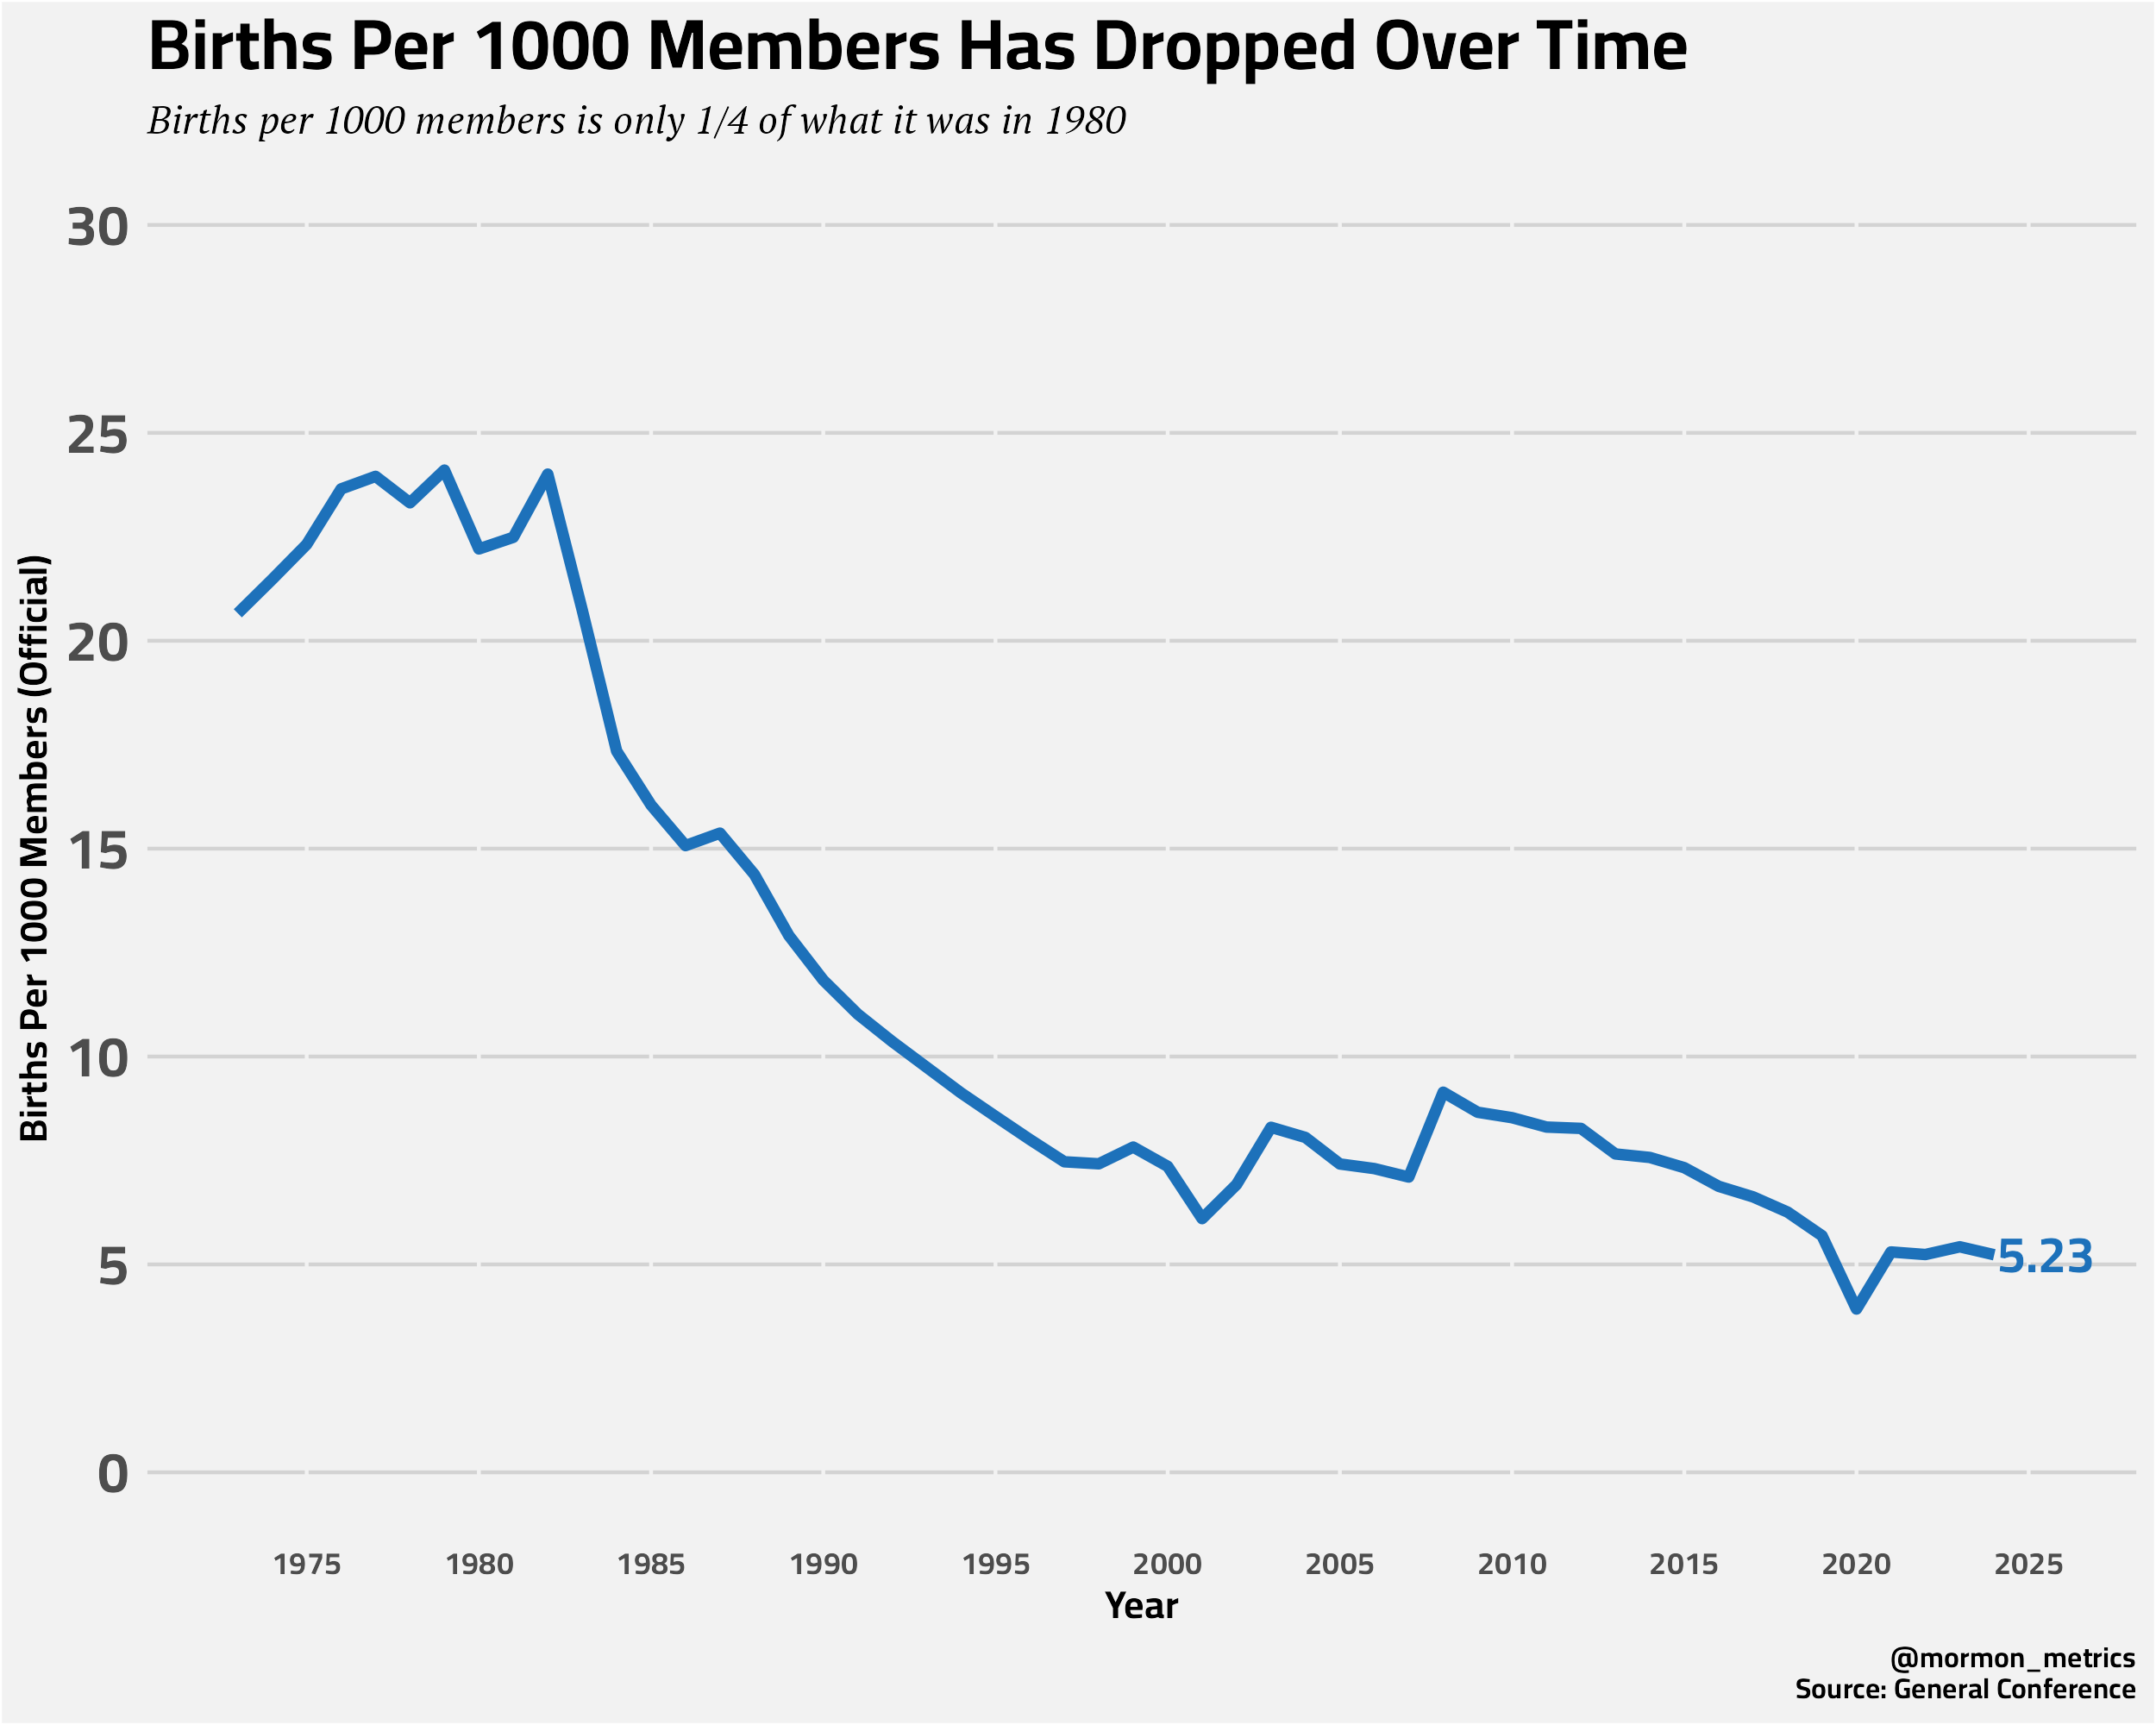
Looking at births per 1000 members, since 1980 it is almost 1/5 of what it was.
As I have written about before, there are at least two things going on…
The birth rate among latter-day saints is dropping. This is obvious, but do you really believe it has dropped by 5X since 1980 like we see in the chart? So a family who would have 15 children in 1980 now has 3, a family who would have 10 children in 1980 now has 2 and a family who would have 5 children now has 1? This seems way too drastic. I would believe a factor of 2 decrease, but not 5. So what accounts for the other part of the decrease?
Since this just counts Children of Record births, it could be suggestive of more more members going less active (and therefore not blessing their child as a child of record yet still being counted on records).
In the blog I linked above, he talks about “number of record removals“ as a metric, and I think that’s a good way to look at the data. This metric is designed to account for a sum of three things:
death
excommunications
voluntary record removals
I’ll call this metric the “exits.“ So let’s plot it!
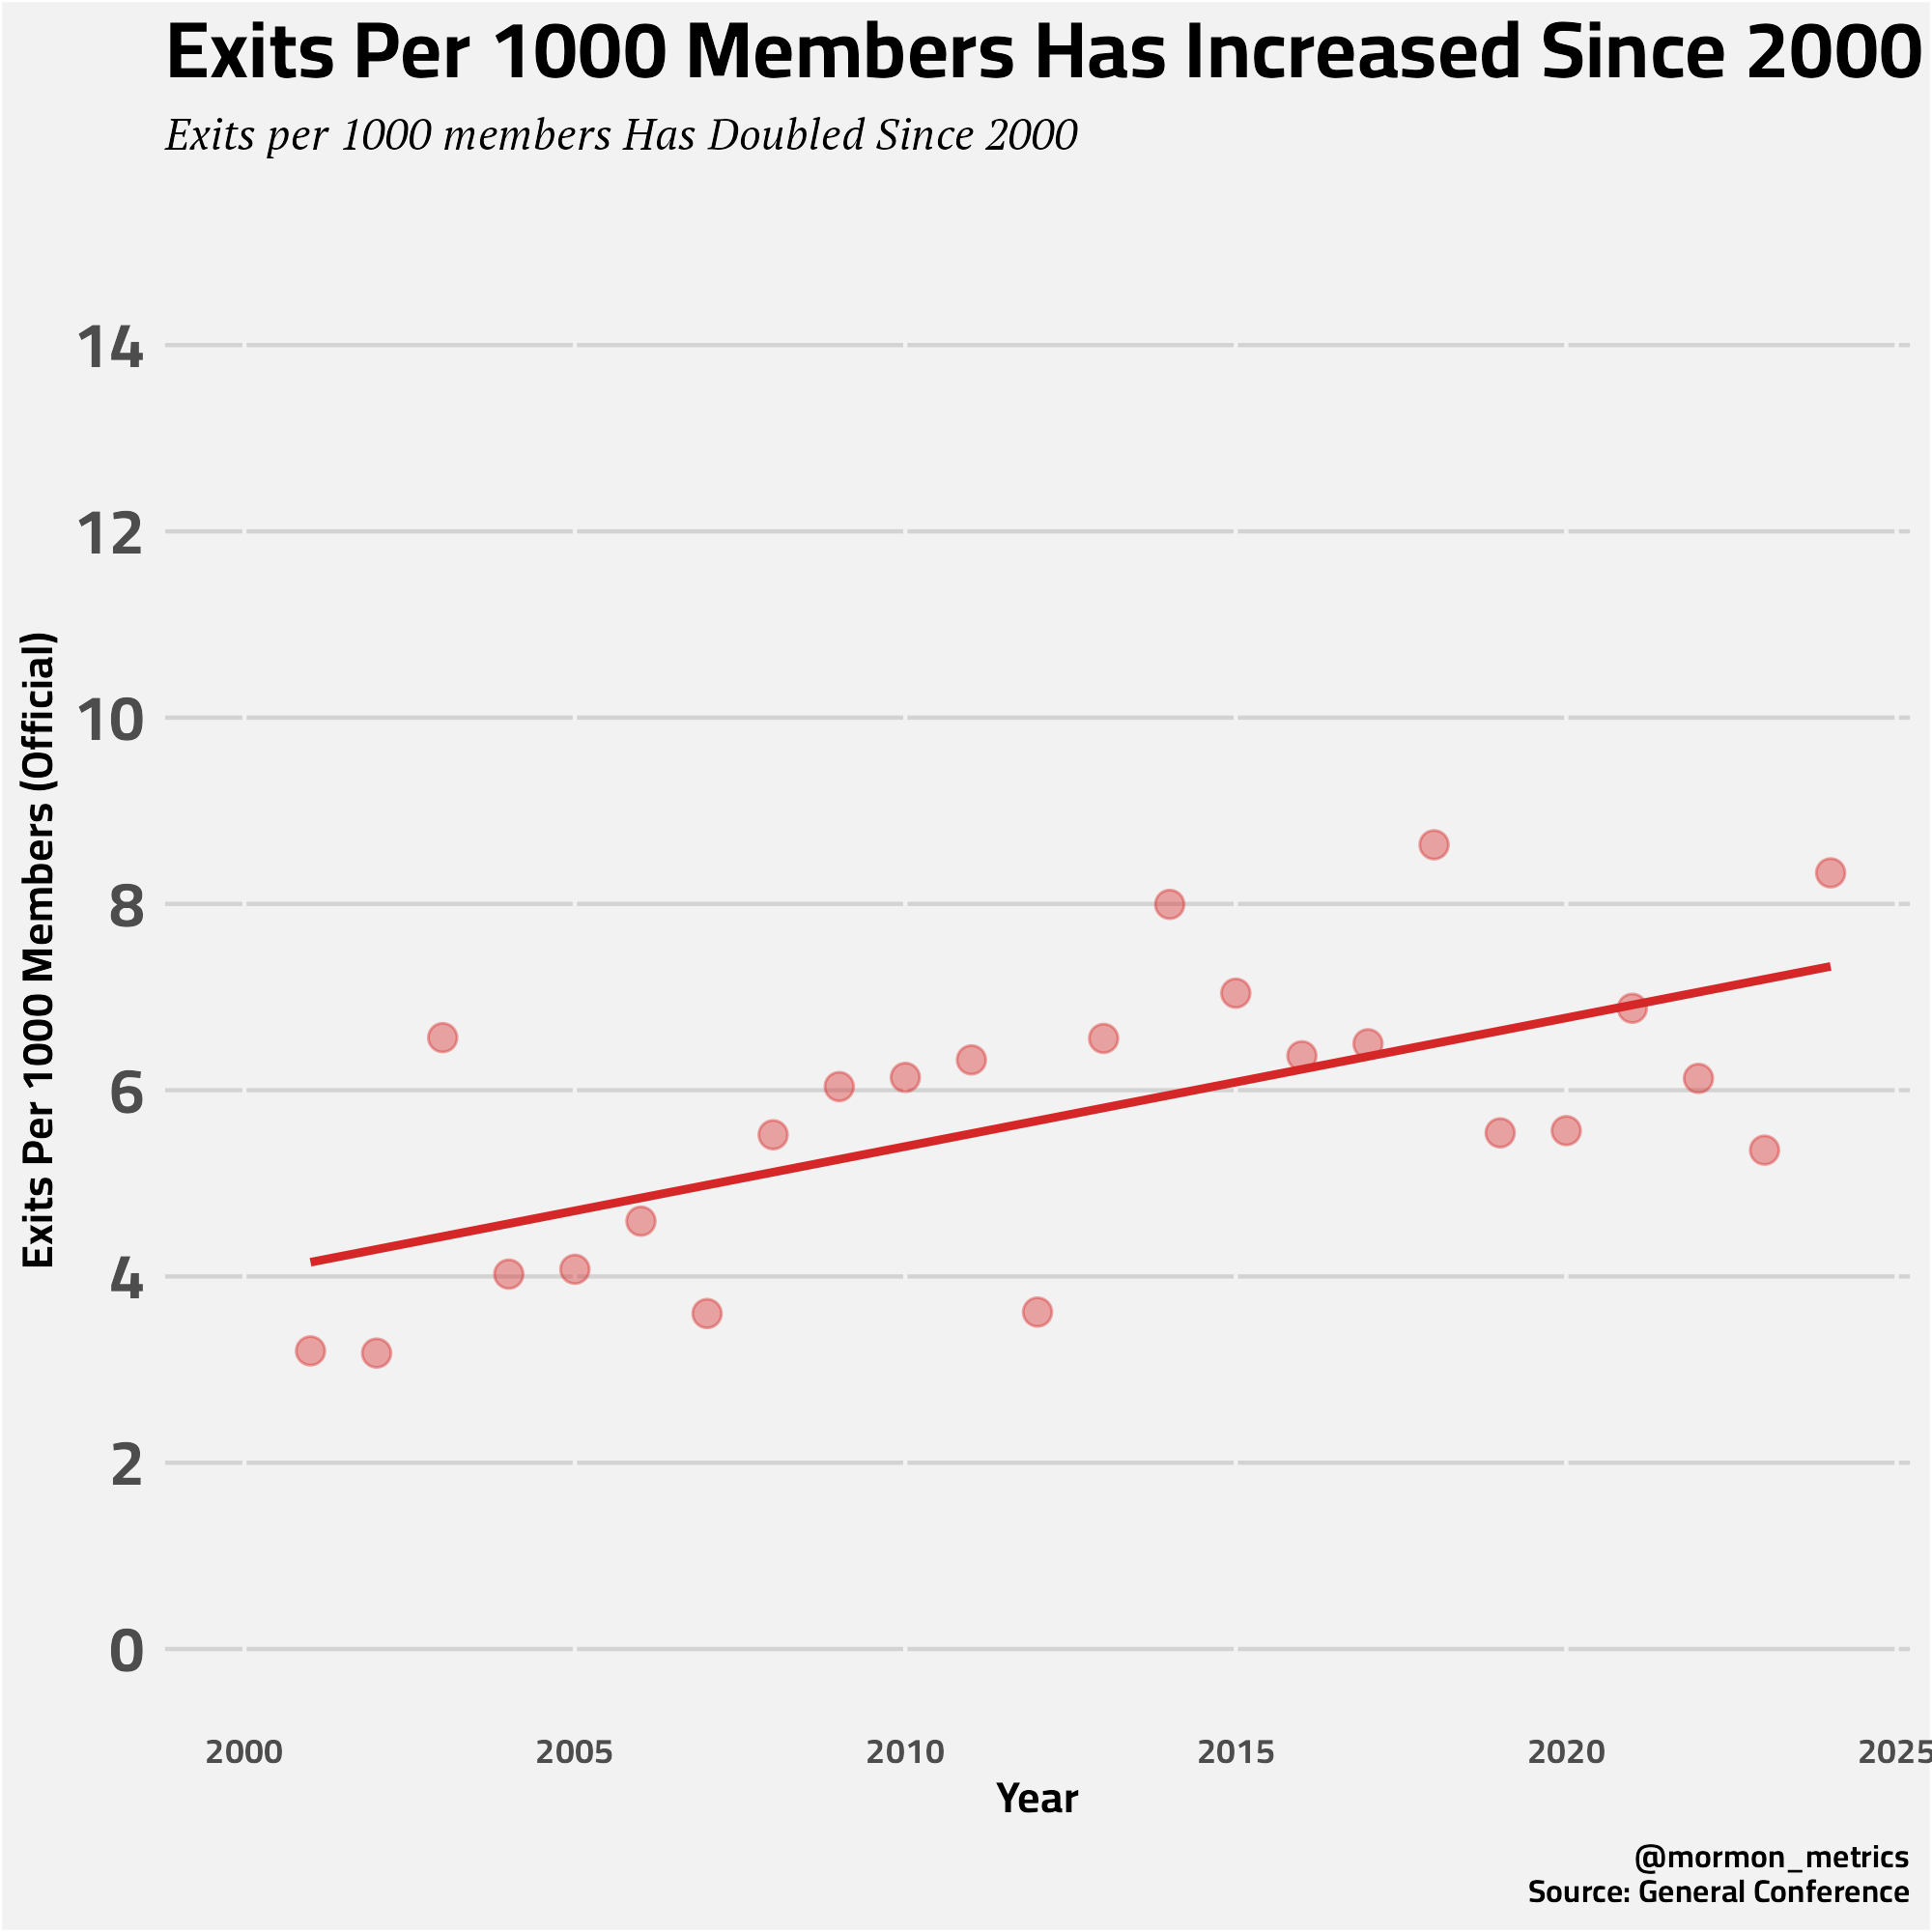
The number of exits has increased (92,424 in 2023 to 145,912 in 2024 a 63% increase YoY). We can also see “exits” doubled the last 25 years.
So which one of the three is going up: deaths, excommunications, or voluntary record removals? We can’t be sure. Besides covid (and we don’t see much effect from covid on this chart surprisingly), there hasn’t been evidence of death rates going up at the level that we’re seeing here.
Also, we don’t have any evidence that the rate at which people are excommunicated has changed, though it is possible.
I’d wager that more members may be going less active (like we figured in the birth data) which would increase the number of exits if we say 1 out of every 3 less actives removes their records(just pulling that number out of thin air). This would also support previous analysis I’ve done from the Pew Religious Landscape Study where I found a 54% increase in disaffiliated members from 2007 to 2024. A 54% increase since 2007 tracks pretty well with the exit chart above. Link to analysis👇👇

Another possible explanation is that the records are being cleaned more in recent years leading to more exits.
Conclusion
The short version: more missionaries and converts, but more exits and low birth rates.
Thanks for reading this week. What are your thoughts? Would you add or takeaway anything to what I have shared? Let me know in the comments. Hopefully you've found the charts insightful!
My code is available here.
If you want to dive into charts even further, here is a link to several more charts in the tabs of this google sheets workbook (as of the time of writing it has not been updated with the 2024 data.)
Great data. Good to see missionary work rebounding at a high rate!
The TFR (total fertility rate) per woman for LDS was estimated to be 3.3 in 1981 (almost double the US average of 1.8). Today it’s probably around 2-ish. That’s a decline but not a 5x drop.
Thank you for this!