

How Have Mormon Demographics Changed The Last 10 Years?
First Look At The 2024 Pew Religious Landscape Data On Mormons


Introduction
Well, I wish I would have started my leavers analysis oh say 1 month later. On 27 February 2025, they announced a survey report for yet another Pew Religious Landscape study fielded in 2024. It comes now a decade since the last one in 2014, but only right after I wrote my 4 part analysis on the 2014 data 🤦♂️. If you would like the see the 2014 analysis, here is the link:

We can call todays post an unofficial part 5 updating some things with the new data.
They asked the “what religion were you raised in” question, so I can replicate my analysis on the new data!
Generally, what I am finding in the new data is… education (and the gender interaction) is not as big of a factor in leaving in the recent years. Race and marital status remain gatekeepers of the Mormon identity.
I wanted to look at some overall movements now that we have 3 data points (2007, 2014, and 2024). I added a few modeling charts - looking at how the probability of leaving has changed over the years specifically by race and marital status.
Its a longer post than normal because of the additional data and I just kept finding and adding things 😅
Charts
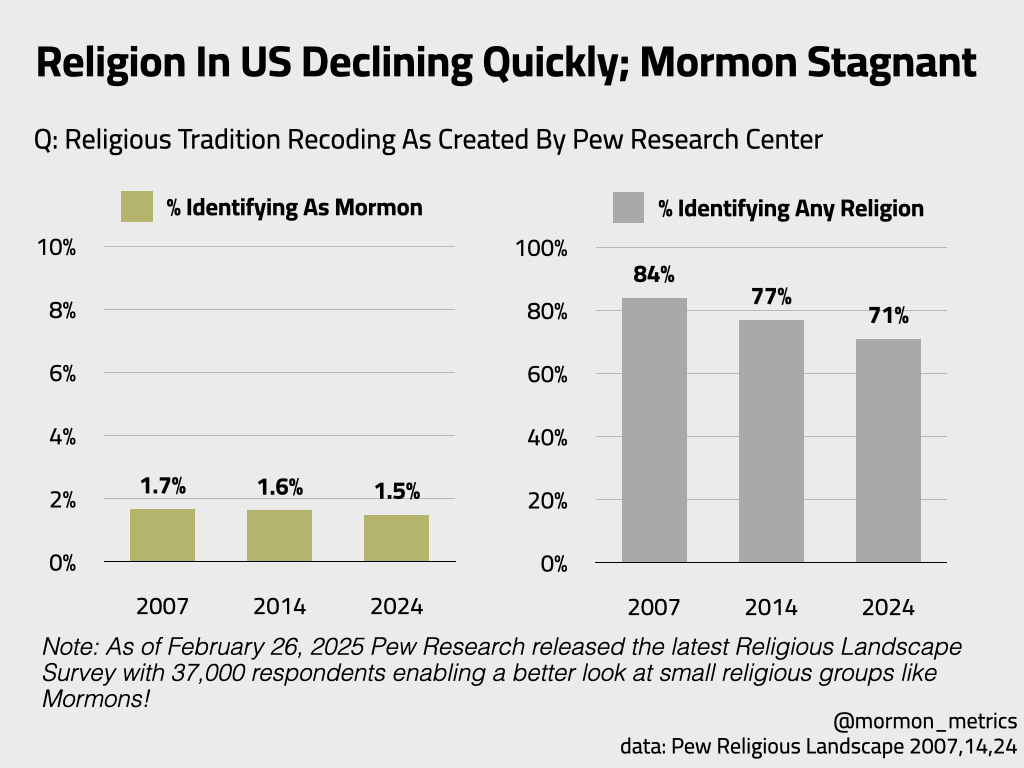
When we look at the overall numbers, people identifying with any religion are declining at a seemingly linear rate (it actually has slowed down since the 2024 data point is further away than 2007 and 2014). One of Pew’s takeaways was that the leaving religion trend in the US has flatlined in the last couple years.
The church growth in the US has stagnated and our best guess is that it is declining slowly though we cannot be statistically confident. This guess aligns with Cooperative Election Study data which shows something similar (if interested the article is attached below):

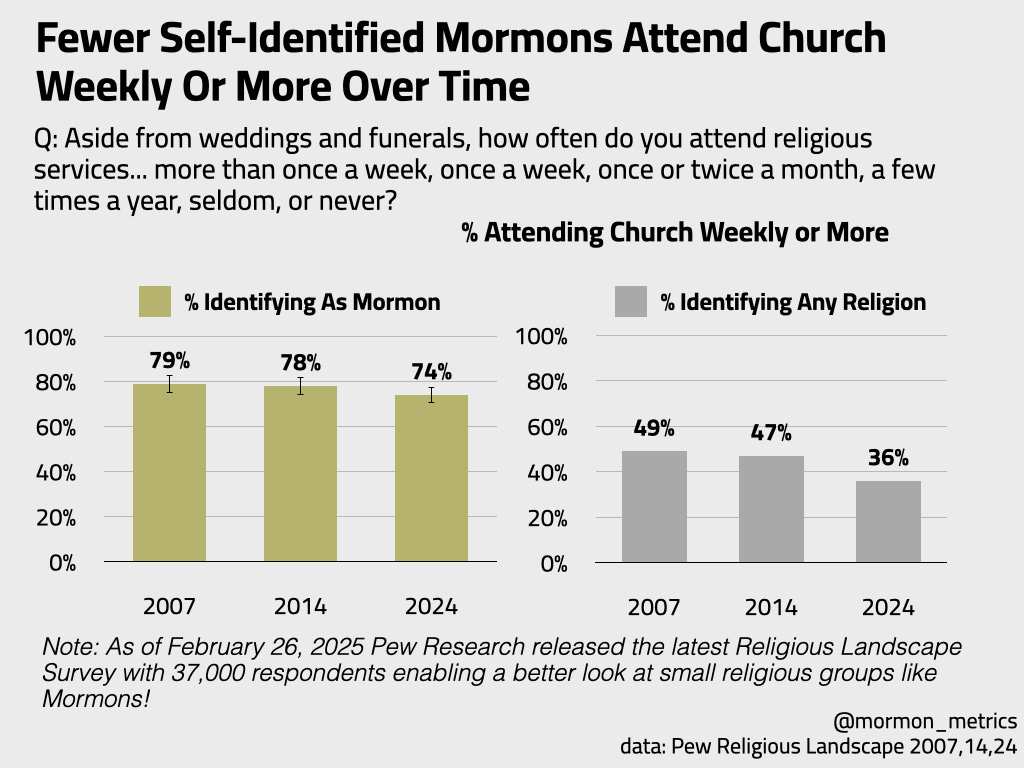
We see church attendance dropping slightly in Mormon land, but these decreases are more pronounced in the US population as a whole (49% weekly or more to 36%).
Remember however that the gold numbers above are only those who identify as Mormon. These don’t include the disaffiliated who no longer identify with the religion.
So, what does disaffiliation look like?
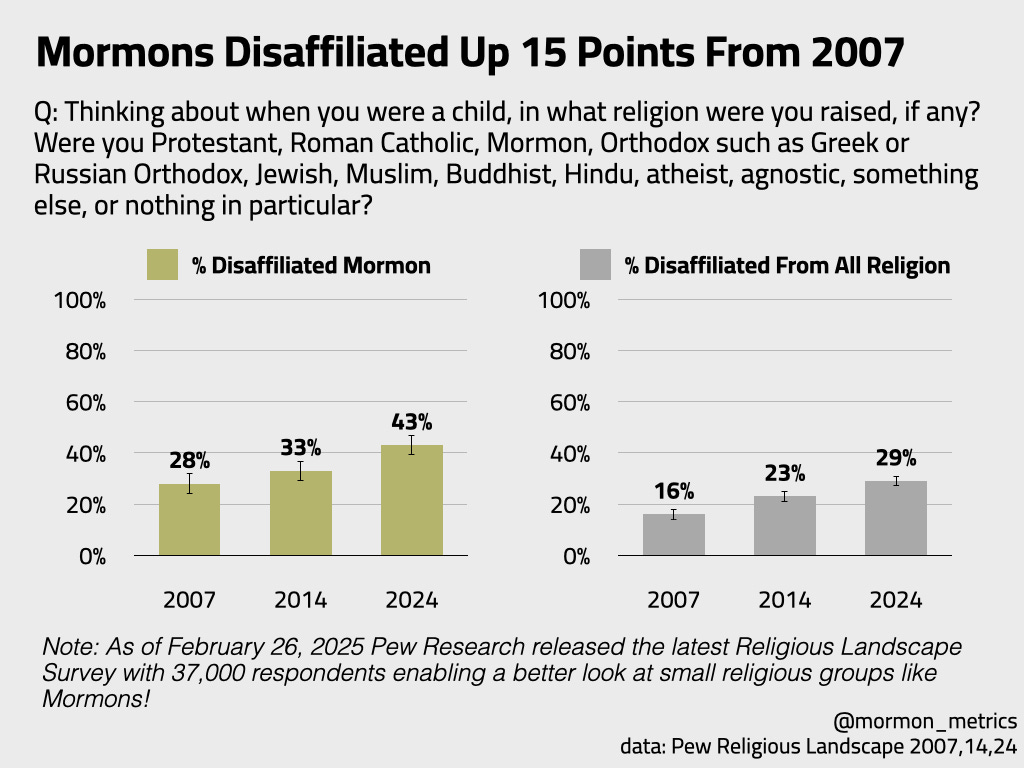
The numbers on the left are those who grew up Mormon, but no longer identify as such. The number on the right are those who identify as disaffiliated from all religion.
There is a clear statistically significant rise in those disaffiliating from Mormonism especially in the last decade. The rise is correlated with the rise of those disaffiliated with all religion. Mormons more often than not join the disaffiliated group when leaving, but they likely won’t move the overall population number in any significant way because its such a small group.
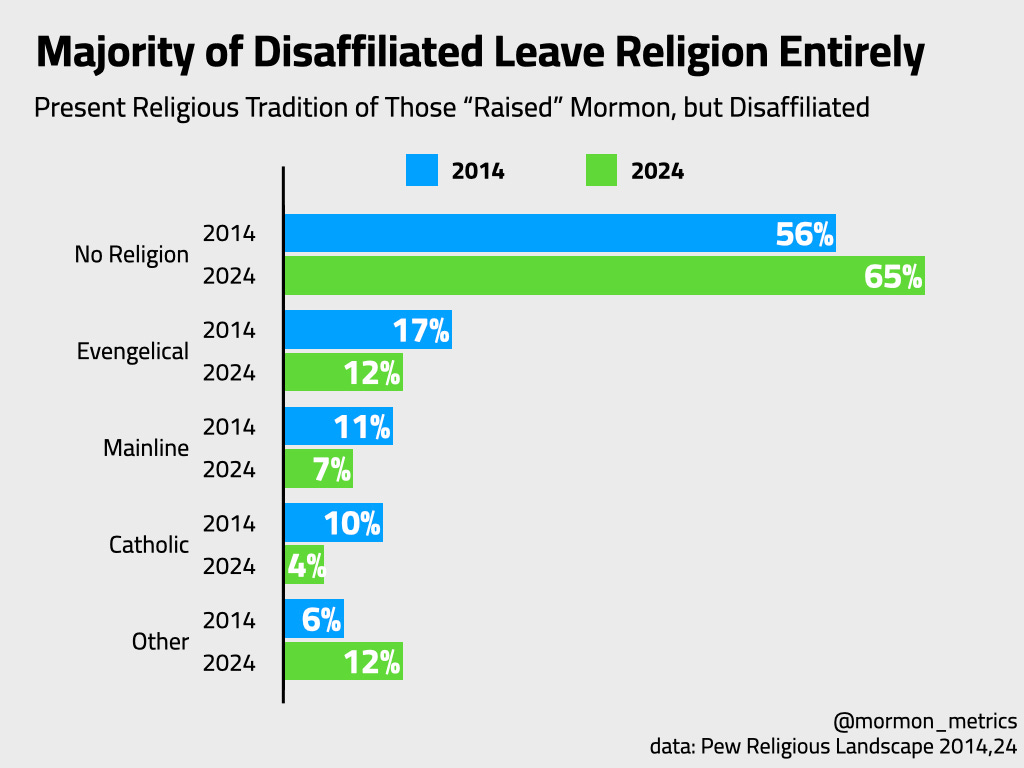
In the last 10 years, we see the that the pattern has become even more pronounced. 2/3 of those who leave the Mormon church leave religion entirely up from 56%.
I also did check the “other“ category and its spread pretty evenly across various small religions.
2024 Demographic Update
This table is pretty messy - sorry. I wanted to include the change from 2014, but it makes the table more cluttered than it already is. Instead of writing notes below, I included brief notes on the side pointing to the relevant parts of the table.
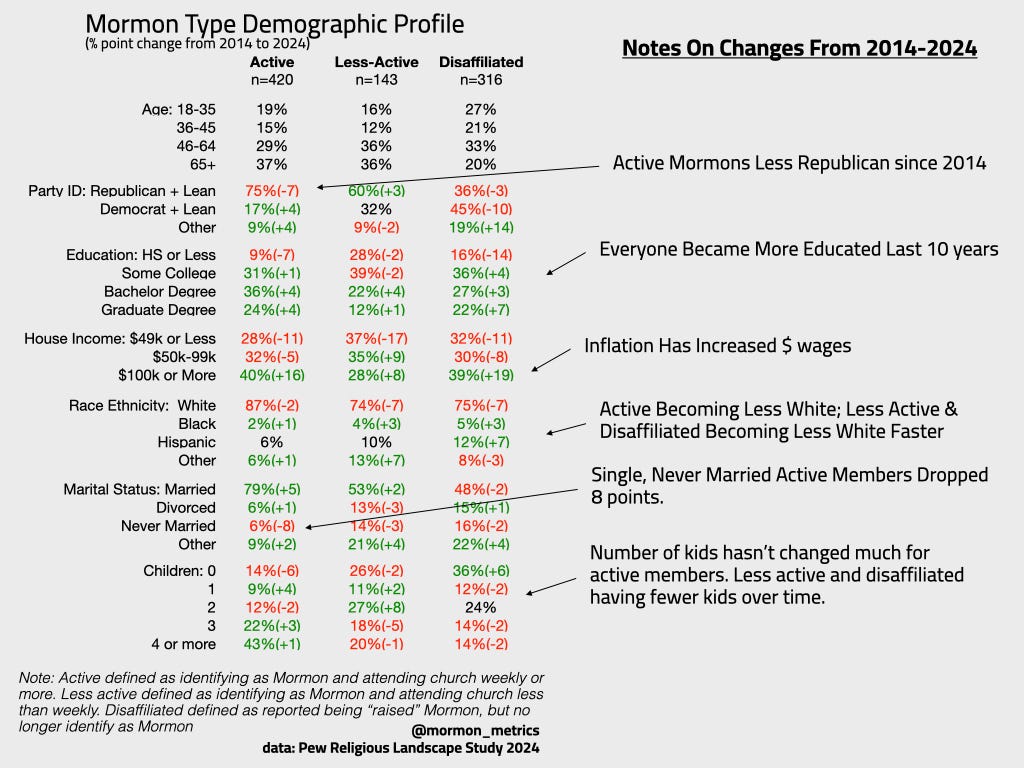
I do not include age and gender percent changes for different reasons. For age, the grouping didn’t match as they are waiting to release more of the age data for privacy reasons. For gender, the question is different. In previous versions, they didn’t include an “other“ option; however, in this one they did. Also, something might be weird with the sample with gender1.
I haven’t explicitly pointed it out before, but there is a clear division in Active, Less Active, and Disaffiliated with number of children. Just look at 0 children vs. 4 or more children. 43% of Active Mormons have 4 or more children and that has stayed constant in the last 10 years whereas only 14% of disaffiliated have 4 or more children and the number of disaffiliated with 0 children is growing.
Less active members are less educated than active and disaffiliated members. In the last 10 years, the education gap has closed more between active members and disaffiliated members, but still exists especially at the bachelor level (36% bachelor for active vs. 27% for disaffiliated).
Modeling Updates
I estimated a model for each year (2007,14,24) and predicted the probability of leaving by marital status and race to get a sense of how things are changing/have changed.

In part 3, I argued that the church should give more attention to those that were divorced, but the probability of singles leaving as shot up significantly in 2024. From around 30% to now over 50%. The probability of divorced leaving has also increased from 57% to 64%. Now, nonmarrieds are even more vulnerable with singles looking more similarly to divorced compared to 2014.
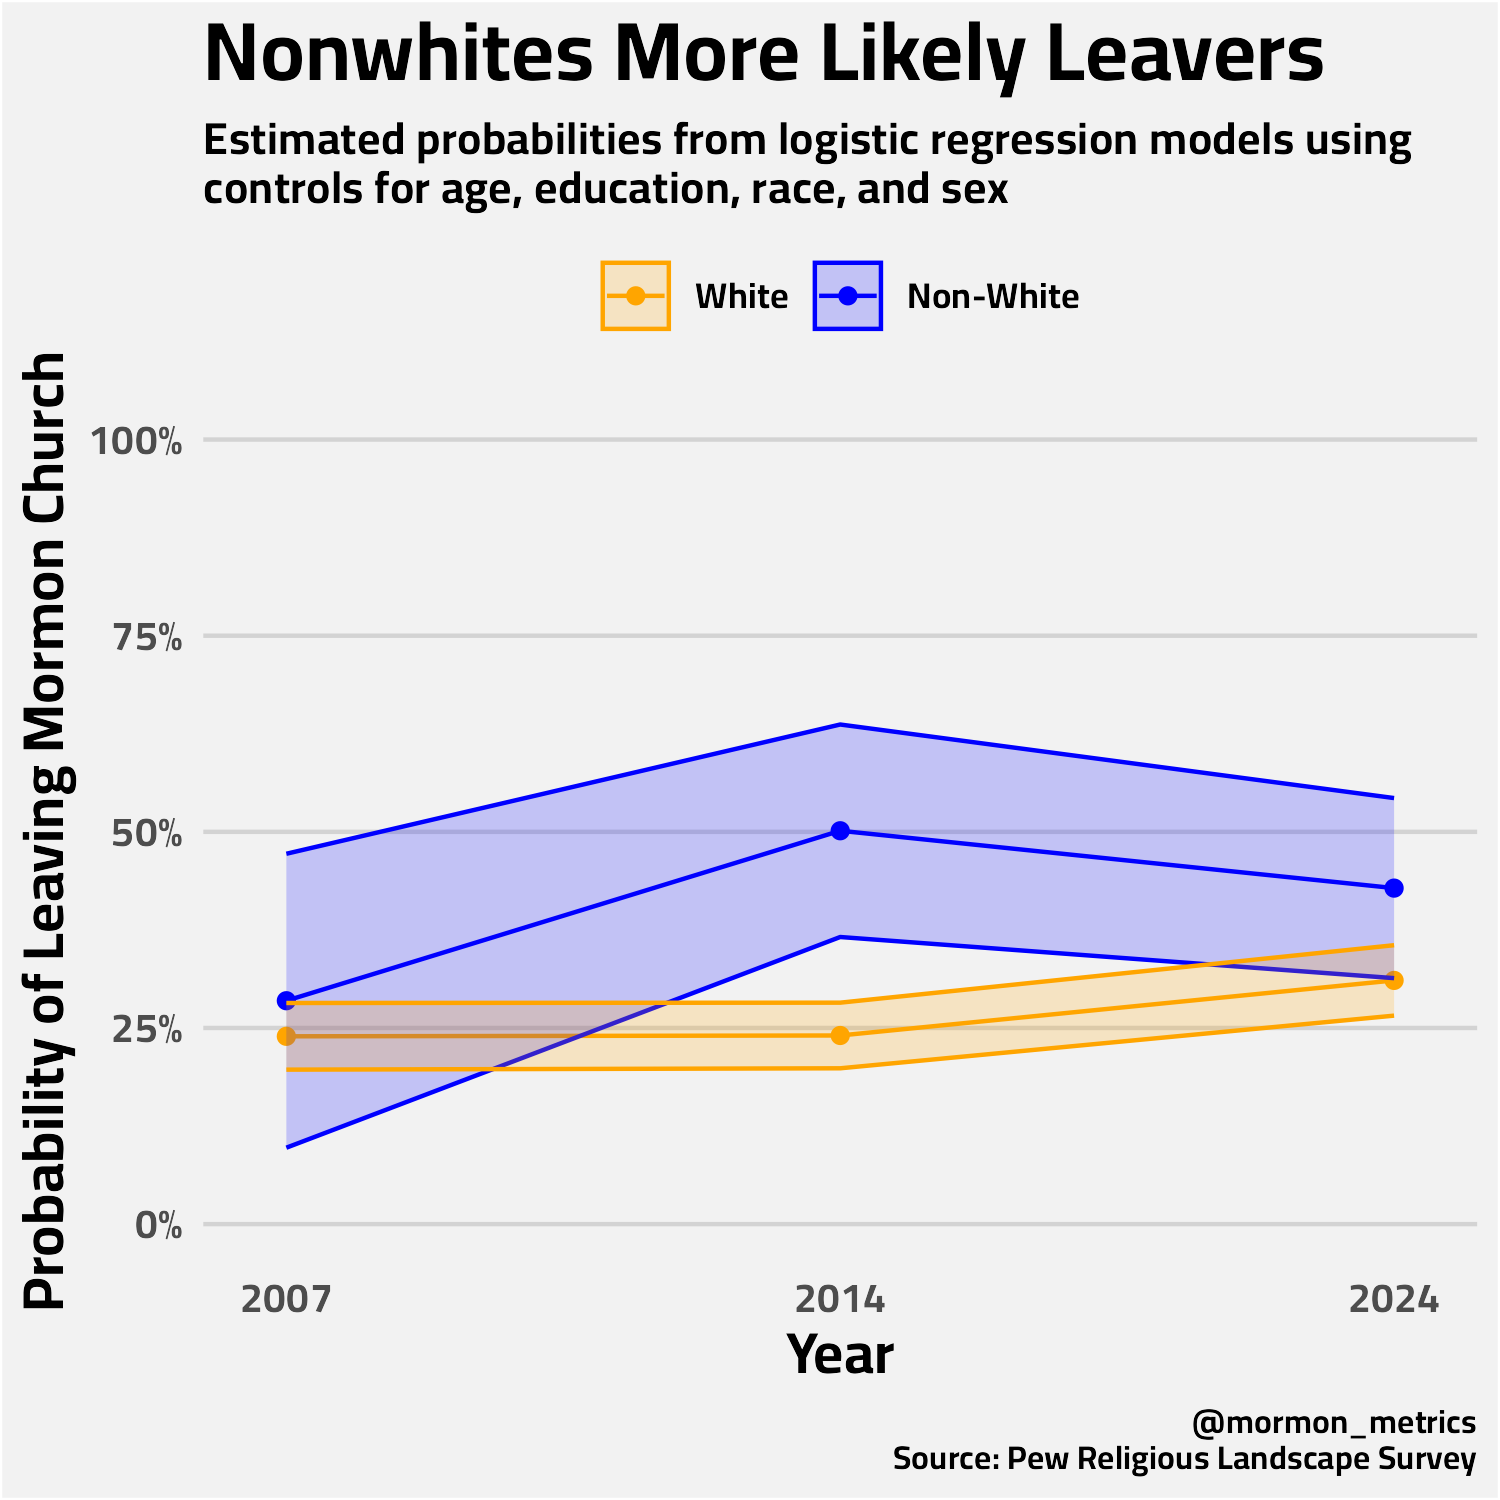
One positive sign for Mormons is that the leaving gap amongst Non-Whites seems to have closed a bit. Whites are now more likely to leave and Non-whites less likely to leave than the previous estimate. There is still a statistically significant difference between the two groups, but now only at the 90% confidence level.
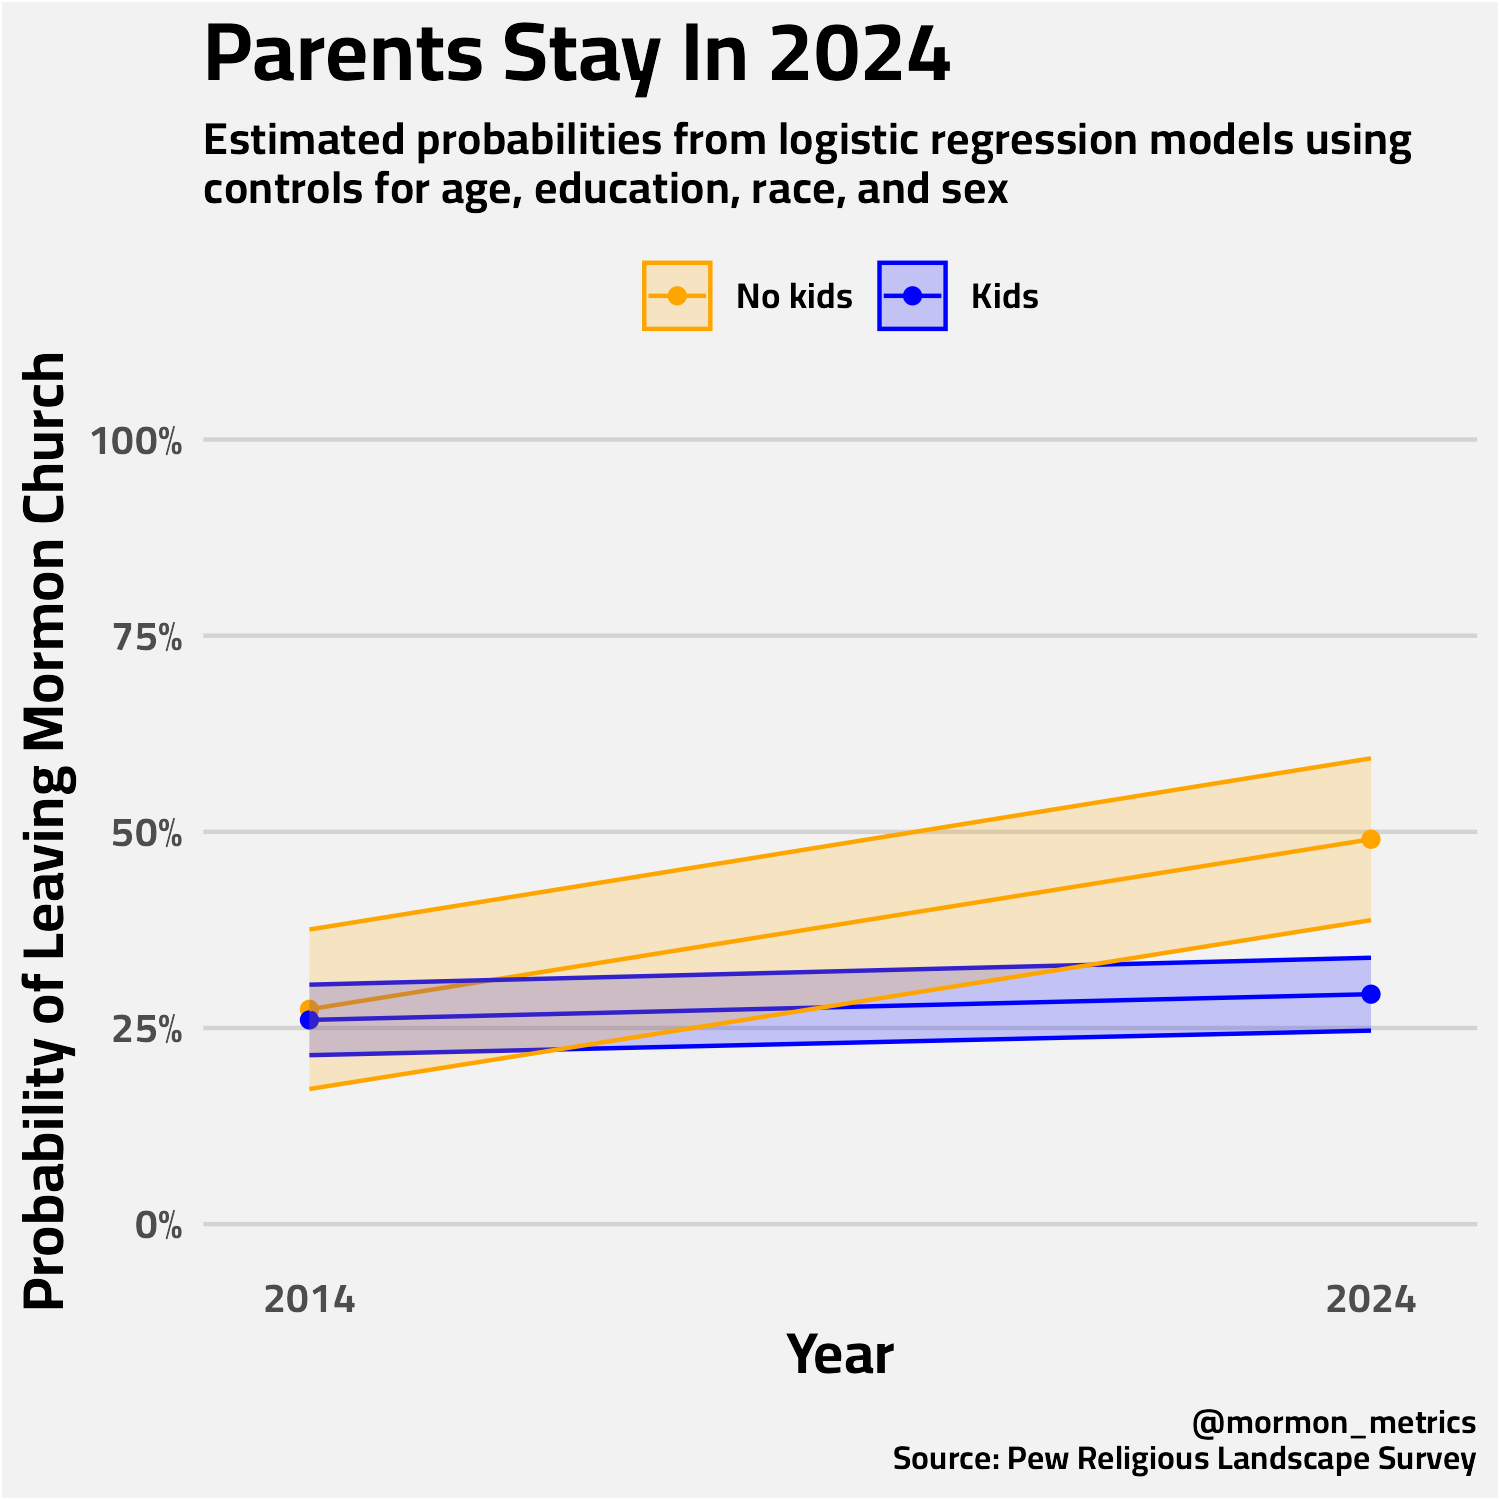
2007 is not included because they don’t ask a total fertility question only a children in home question.
I didn’t see a statistically significant difference in 2014, but in 2024 we see that those with kids are statistically more likely to stay in the church. I’m not sure why this is the case. Perhaps it is due to a statistical blip in 2014 or since there are fewer single active members in 2024 we can see the division more clearly.
Conclusion
My main takeaways so far are (with more analysis of this dataset to come)…
In the last 10 years, the number of people identify as Mormon is the same in the US population, but there was a significant increase in those who disaffiliated among those who were raised Mormon. Perhaps the difference is being made up by an increase in convert baptisms? Im not sure.
There was a drop in active never married singles. From a preliminary look, it seems singles are more vulnerable to leaving than they were 10 years ago. The singles look much closer to the divorced group than before.
The data suggests that there could have been gains in fewer Non-White members who grew up in the church leaving since 2014. Though Non-Whites are still statistically more likely to leave that Whites.
What do you think about the new data? Did you see anything that I missed? Are there any questions that you have that could be inspiration for future posts? Let me know!
Code available here.
When you look at the unweighted overall sample of everyone in the survey for 2014 and 2024, males were at 50% in 2014 and 42% in 2024. When we look at the small, unweighted sample of mormons, we see a similar trend 52% are male in 2014 and 45% are male in 2024. I don’t think this is indicative of an actual shift in the gender composition - only a difference in the composition of the sample. Also, not very many respondents identified as gender “other.“ Only 1% in the overall population and 0.4% for Mormons - so the difference wasn’t just because of the third category.
I’m glad I found your Substack. This is just I was hoping for - the LDS Ryan Burge!
Interesting that the Active demographic looks a lot like the Disaffiliated demographic in education and income. It seems like the progression of dropping out is not Active - Less Active - Disaffiliated, but rather two tracks. The less educated/lower income go from Active to Less Active, while the more educated / higher income go from Active to Disaffiliated. Does that make sense?
Also interesting to see the political party and fertility trends among those three groups. Certainly seems like liberal politics and family status (which also correlates with liberal politics) correlate with dropping out.
Great stuff.