
What Is Driving Decline Of LDS Devotion?
Root Cause Analysis of Declining LDS Devouts


A quick note on terms: In this analysis, I use the word ‘Devout’ as a shorthand to describe a specific group of Latter-day Saints—those who reported all three of the following: attending church weekly, praying several times a day, and saying religion is ‘very important’ in their life. An index like this is common method in social science to measure things like high religious observance, though it doesn’t capture all the personal ways an individual might manifest their faith or devotion.
One aspect of my data science work at Meta is the occasional “root cause analysis” or “metric investigation.” The premise is simple. One of our key business metrics is declining, WHY? I will then investigate. Is this a seasonal trend? Is there a bug in the app, if so, which version? Is a certain demographic group falling off? What are competitors doing? and so on…
Today, I have an opportunity to do this type of analysis for Mormon Metrics!
One of the findings of the Mormon Typology 2025 I released in September was that the most devout group of Latter-day Saints had been declining in the last 20 years. The typology analysis was based on combining data from all three waves of the Pew Religious Landscape study.
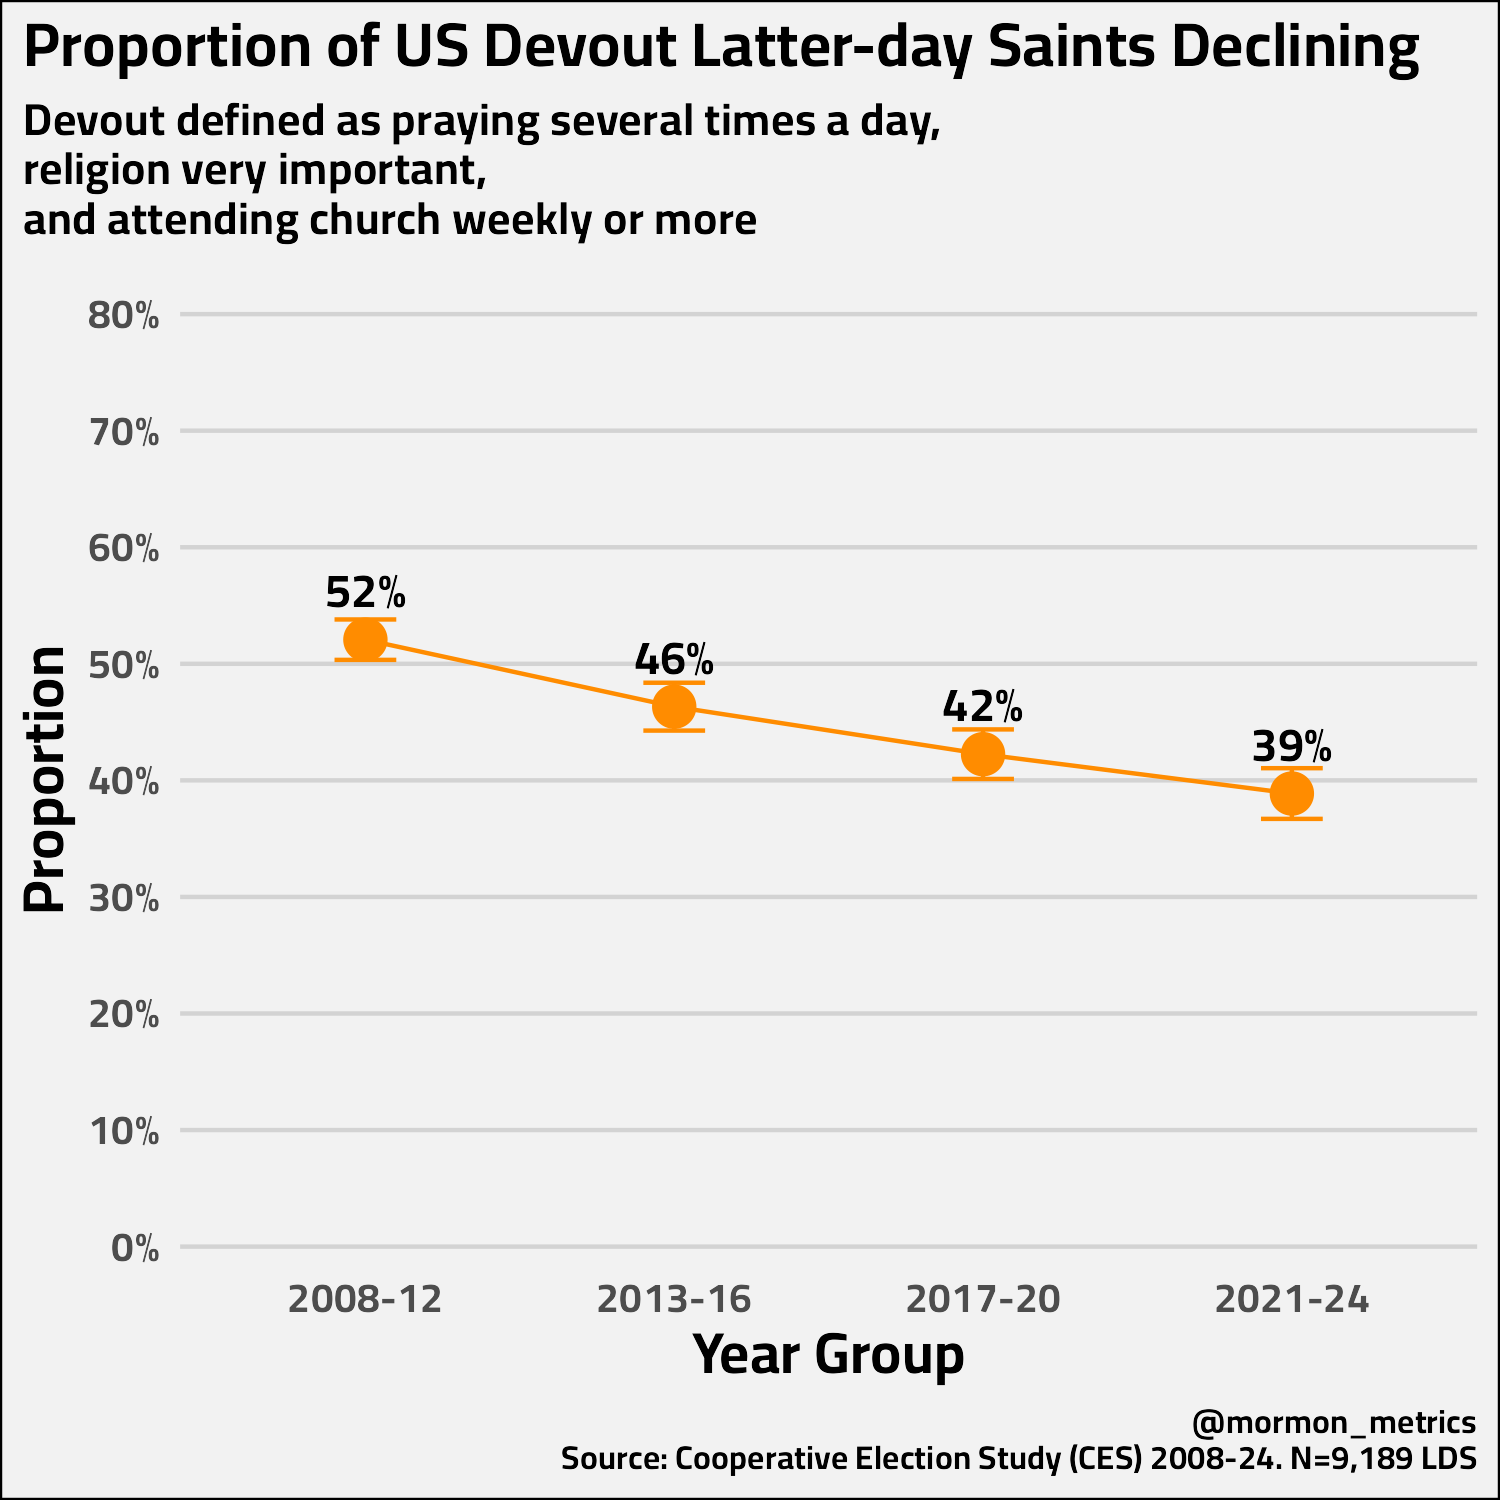
The next week, I confirmed this finding with arguably the most definitive public dataset of US Mormons, the Cooperative Election Study, which showed a statistically significant decline of those indicating the highest levels of religious practice (and personal religious importance). Here is the chart:
But, an important piece of this analysis is missing… What demographic groups are driving this decline? OR are they all declining equally together? The Pew Religious Landscape study quickly dropped into low nsizes when trying to analyze subgroup devotion, but perhaps we can see who was driving the decline from the higher powered Cooperative Election Study…
And, I’ll cut to the chase. I analyzed several demographic variables over time including age, gender, ageXgender, education, party, and race.
What did I find?
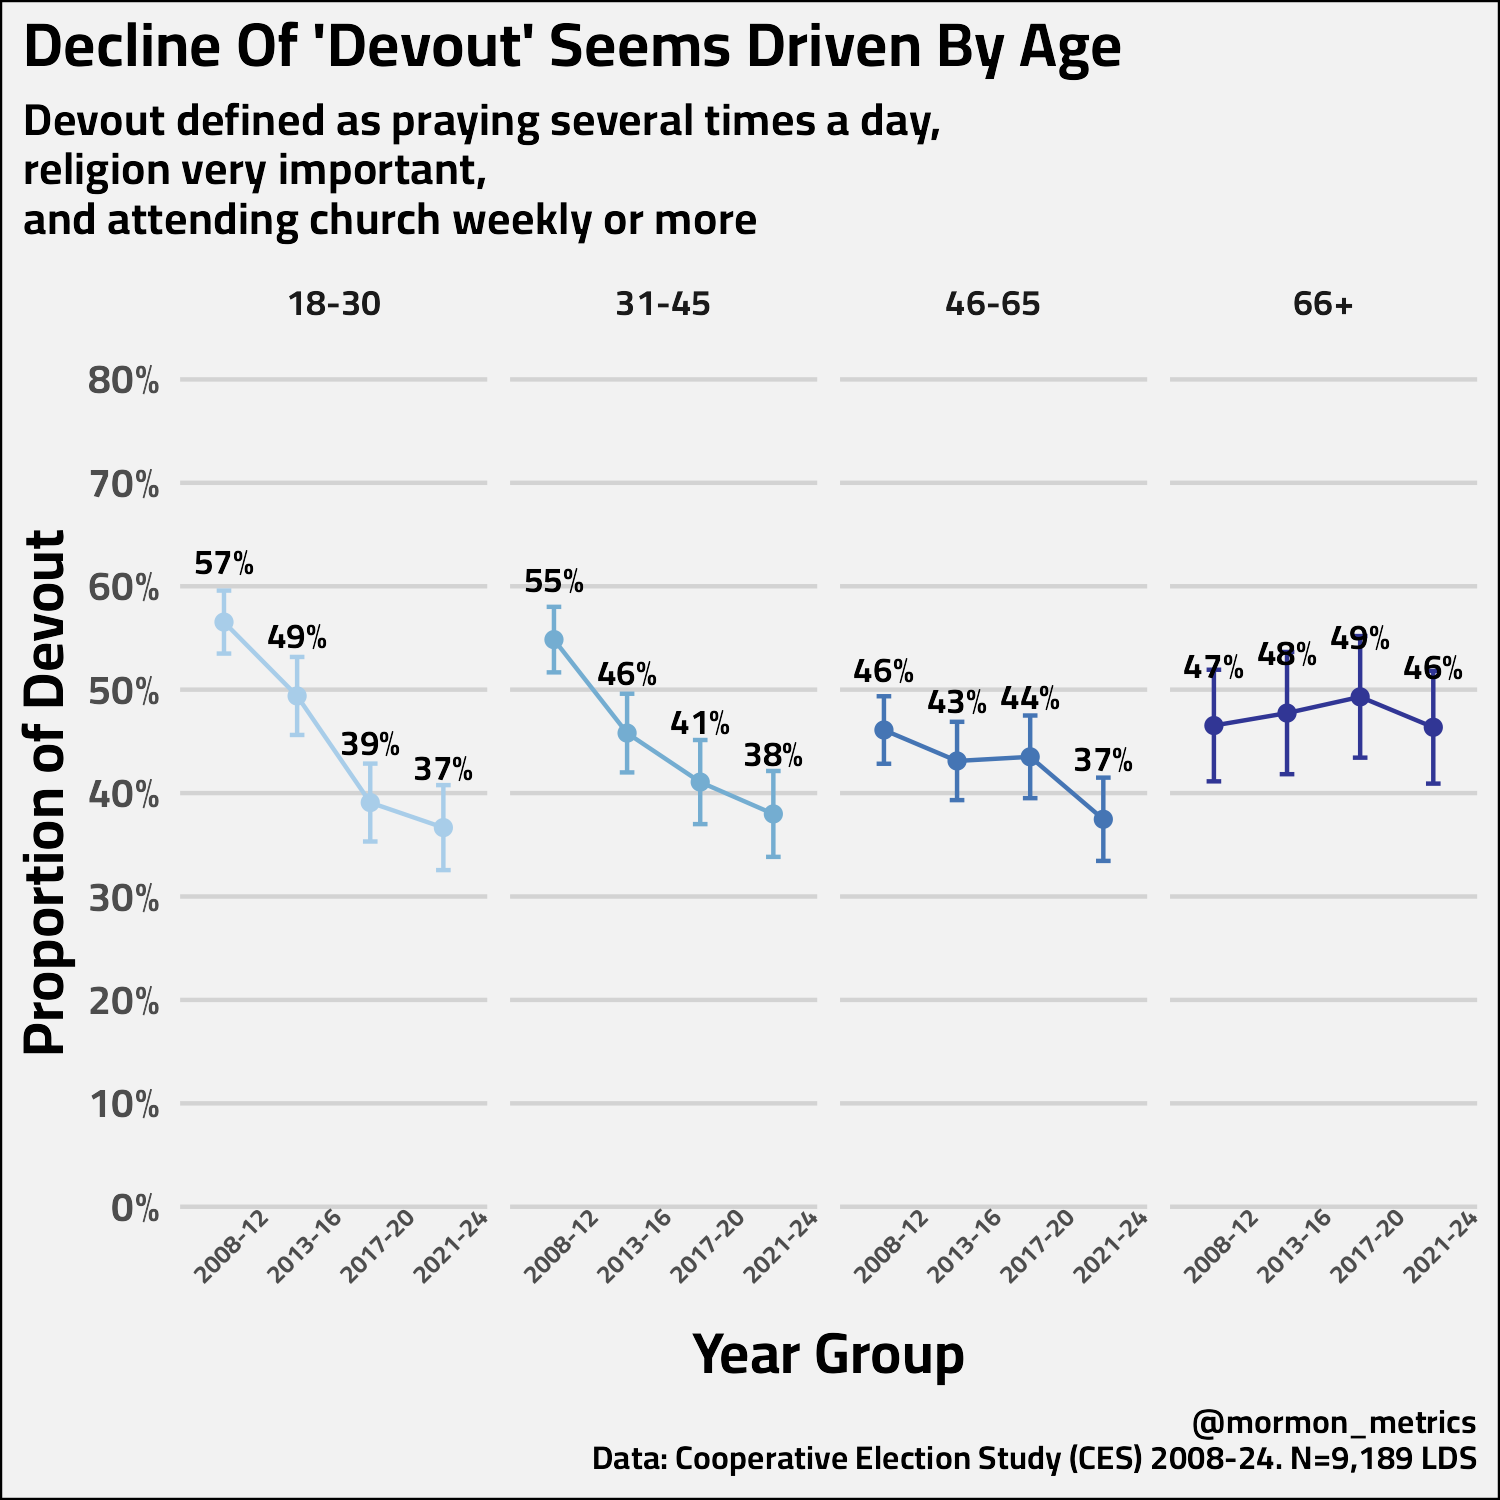
Age seemed to be the primary driver of these changes. Just look at these trends. We see the largest drop among the youngest age group 18-30 who are now 20 points less devout than 15-20 years ago! And, during that time, the proportion of devouts age 66+ has remained constant. In the middle groups, we see smaller effects. We still see declining, but not as sharp — especially for those age 46-65.
Another correlated driver, though seemingly not as meaningful as age, is political party.
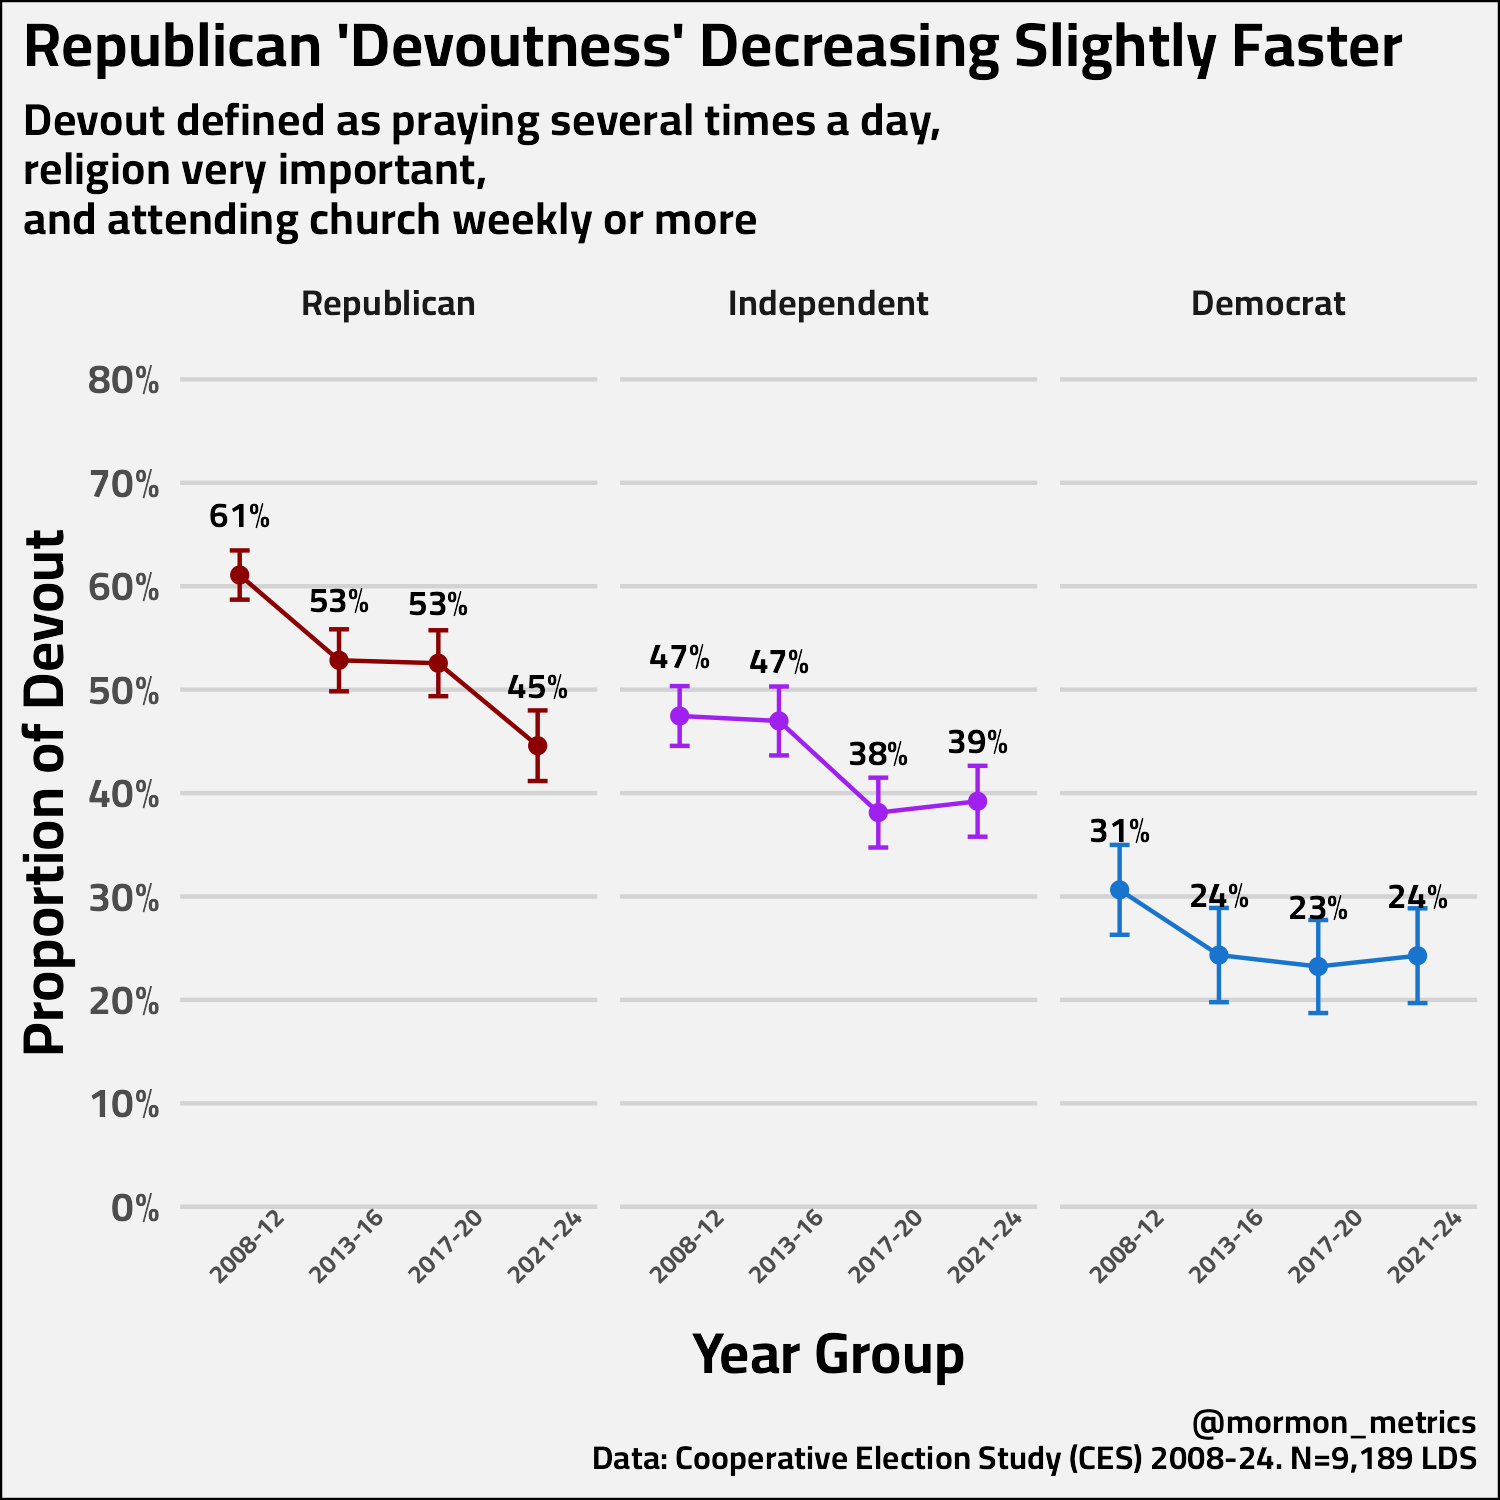
Democrats started at a lower baseline 31% devout vs 61% devout, but only decreased 7 points. Republicans, however, have decreased 16 points in devoutness while Independents have decreased 8 points.
I think equally interesting is the variables that don’t seem to meaningfully affect declining devotion. These variables are gender, race, and education.1 Among these variables, subgroups are declining at similar rates. I plan on looking closer at gender another week because I have found conflicting evidence in datasets suggesting different things.
I also know some of you might have birth cohort vs. age questions. I looked at birth cohorts vs. age over the 20 year period and the data was pretty noisy. But, the age chart I do have (above) shows a cohort effect. The ‘18-30’ group in 2021-24 is a mostly new set of people than the ‘18-30’ group from 2008-12, and they are starting from a 20-point lower baseline. That’s a classic sign of generational replacement.
So, what is driving the decline of the devouts? We don’t have all the answers and like many social issues, the answer is likely complex and multifacted. What we do know is the decline of devotion is more related to the younger generations and changes that have taken place the last two decades.
Why do you think young LDS people today are less likely to pray several times a day, attend church weekly, and say religion is very important in their life vs. 20 years ago?
Let me know what you think in the comments and see you next week!
Code available here. Data downloadable here.
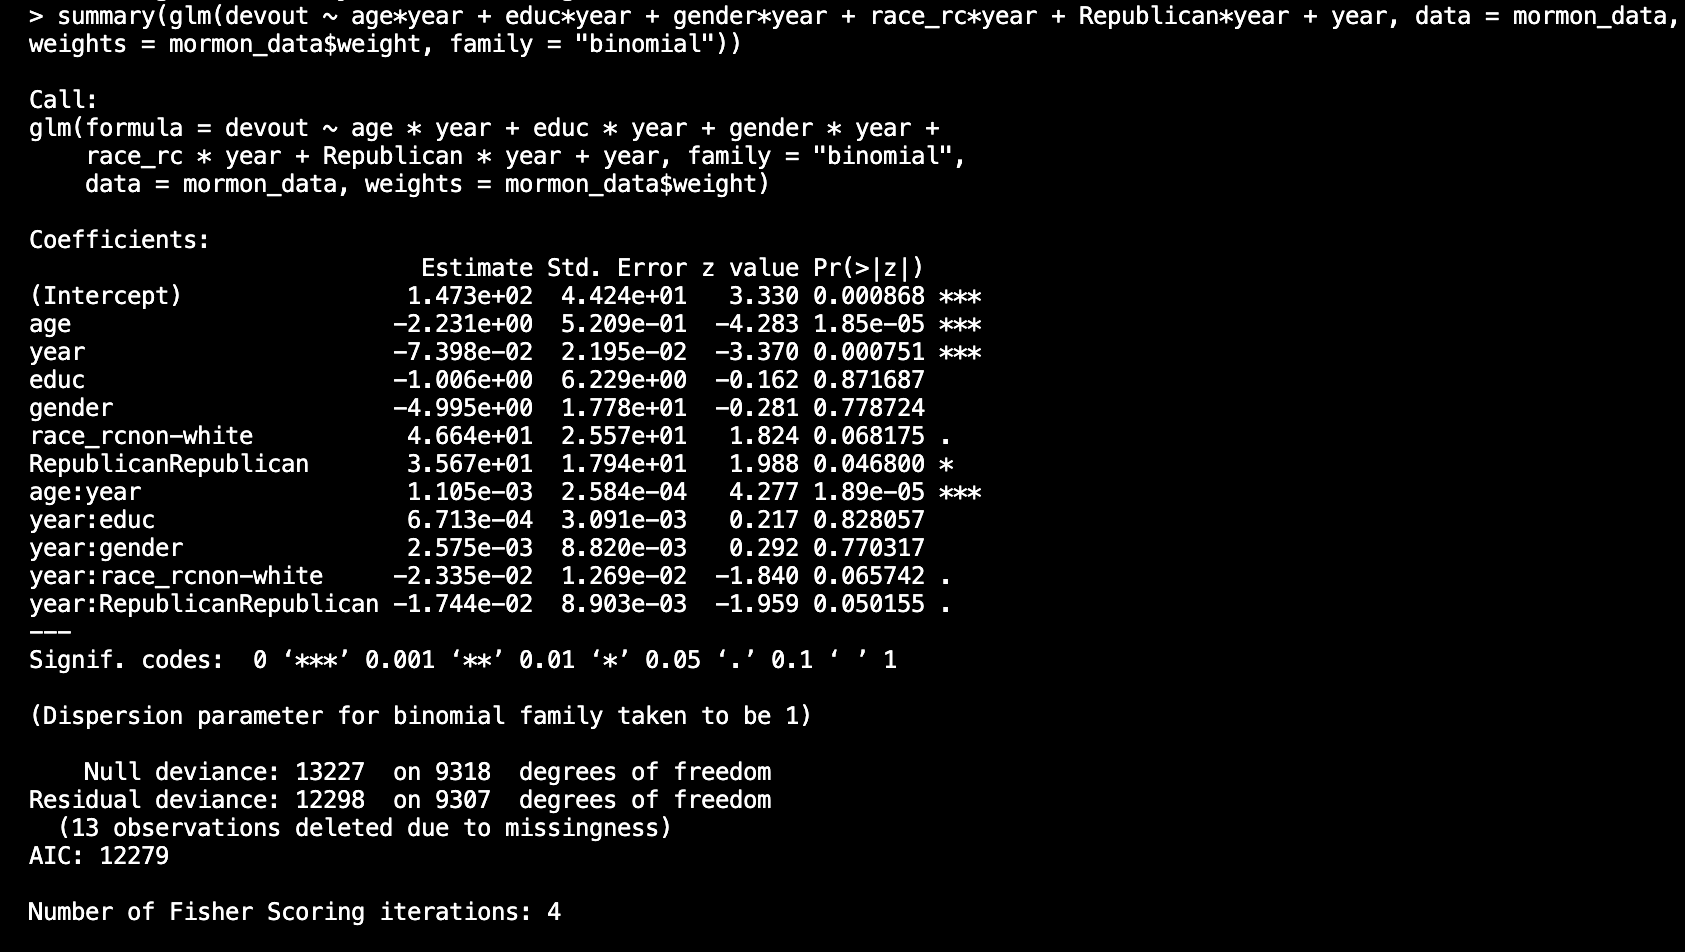
I don’t have nice regression charts today with confidence intervals, but I did include a screenshot of the regression results for the followers that’s meaningful for. I interacted year with each of my variables to get a sense of how it has changed over time leading me to my two new plots today. As always, complete code is available for download and review.
.
.
This isn't disagreement with the numbers or the results, but I'd like to push back against the words "devotion" and "devout." Almost everyone I've shown your recent stats too---including very devout people, eg, my stake president---don't see themselves in the generalized descriptions of category. In other words (and I know this is beyond the scope of what you're doing) but I think the manner in which actual devotion manifests may not be measured according to extant standards. Devotion, in other words, may not be the same in the world as it is on the graph.
To re-frame the question, why were 18-30 year olds the MOST devout in 2008-2012? I think the old model was that we could assume families were a strong influence of devotion, but that as kids started to find their own path, especially around 18, a fraction would lose their grip on the iron rod. This data might suggest something is changing about families and childhood. Maybe family or child-raising patterns are changing? Or something different in the school environment? Is it that kids have cell phones and social media?